💀 Hey , how's it going ? Come over here — Satoshi got something for you !
⏰ We’re analyzing BTC on the 1-hour timeframe timeframe .
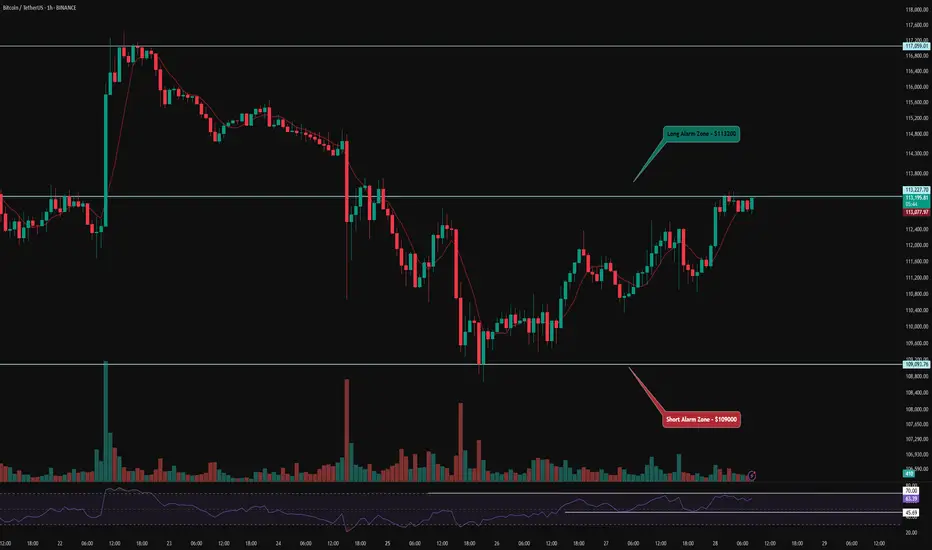
👀 On the 1H timeframe for Bitcoin, we can observe that BTC is ranging inside a box with a top around $113,000 and a bottom around $109,100. With a breakout from either side of the box, Bitcoin can experience a sharp and parabolic move.
⚙️ The key RSI zones are 70 and 45, and once the oscillation surpasses these levels, Bitcoin can experience a solid move with an increase in trading activity.
🕯 The size and volume of green candles are increasing, the underlying trend of the market is bullish, and we are at an important zone. With rising buying volume and larger green candles, Bitcoin could break out of the top of the box and move upward toward resistance levels.
📊 On the 1H timeframe for USDT.Dominance we can observe that Tether Dominance is slowly losing weight in the market after dropping below the 4.35% zone.
At the same time, Bitcoin.Dominance is also declining . This means that altcoins are providing more profit than Bitcoin .
🔔 The zones we have selected as alert zones are $113,200 and $109,000. By monitoring price behavior and recognizing breakouts, we can open our positions accordingly .
❤️ Disclaimer : This analysis is purely based on my personal opinion and I only trade if the stated triggers are activated .
⏰ We’re analyzing BTC on the 1-hour timeframe timeframe .
👀 On the 1H timeframe for Bitcoin, we can observe that BTC is ranging inside a box with a top around $113,000 and a bottom around $109,100. With a breakout from either side of the box, Bitcoin can experience a sharp and parabolic move.
⚙️ The key RSI zones are 70 and 45, and once the oscillation surpasses these levels, Bitcoin can experience a solid move with an increase in trading activity.
🕯 The size and volume of green candles are increasing, the underlying trend of the market is bullish, and we are at an important zone. With rising buying volume and larger green candles, Bitcoin could break out of the top of the box and move upward toward resistance levels.
📊 On the 1H timeframe for USDT.Dominance we can observe that Tether Dominance is slowly losing weight in the market after dropping below the 4.35% zone.
At the same time, Bitcoin.Dominance is also declining . This means that altcoins are providing more profit than Bitcoin .
🔔 The zones we have selected as alert zones are $113,200 and $109,000. By monitoring price behavior and recognizing breakouts, we can open our positions accordingly .
❤️ Disclaimer : This analysis is purely based on my personal opinion and I only trade if the stated triggers are activated .
join our Telegram channel for more insightful and educational content .
t.me/satoshiframe
t.me/satoshiframe
Related publications
Disclaimer
The information and publications are not meant to be, and do not constitute, financial, investment, trading, or other types of advice or recommendations supplied or endorsed by TradingView. Read more in the Terms of Use.