Hello, traders.
If you "Follow", you can always get the latest information quickly.
Have a nice day today.
-------------------------------------
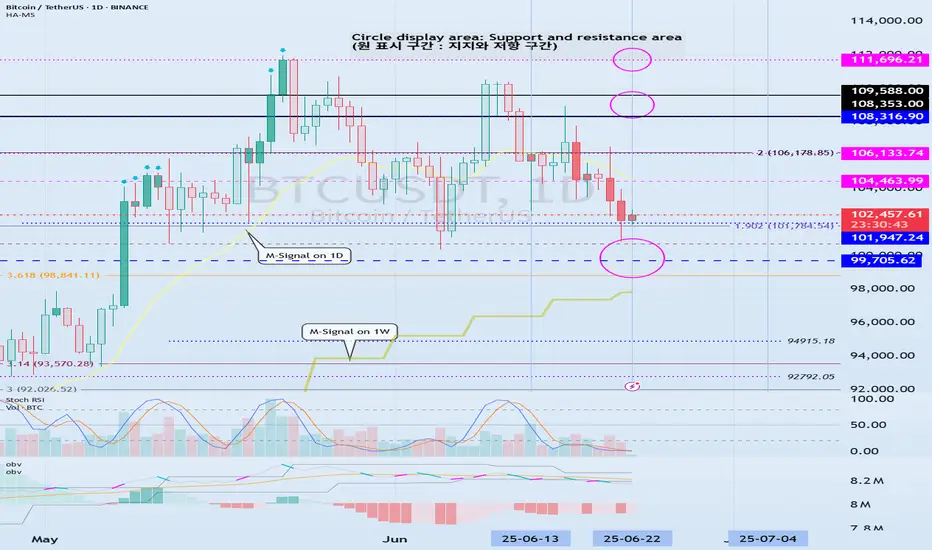
(BTCUSDT 1D chart)
This volatility period is expected to last from June 21st to 23rd.
Therefore, it is necessary to check the trend formed after the volatility period.
The 99705.62 point is the HA-High indicator point of the 1W chart, so it is important to see if there is support near this point.
If it falls without support, it may fall to around 89294.25.
The 89294.25 point is the HA-Low indicator point of the 1D chart.
Since the M-Signal indicator of the 1W chart is rising to around 99705.62, the area around 99705.62 is likely to play an important role as support and resistance.
Even if it turns upward, it must rise above the HA-High indicator point of 108316.90 of the 1D chart to maintain the price.
If not, it is likely to fall again.
-
The fact that the HA-High indicator was created means that it fell from the high point range.
In other words, if it falls below the HA-HIgh indicator point, it is likely to start a downtrend.
However, since the HA-High indicator is an intermediate value, if it is supported near the HA-High indicator, it is possible to show a stepwise upward trend.
The end point of the high point is the DOM (60) indicator.
Therefore, it should be interpreted that it has risen above the high point section only if it rises above the 111696.21 point.
Therefore, depending on how the 108316.90-111696.21 section is broken upward, an upward trend can be predicted.
----------------------------------------------------------------------
There are auxiliary indicators OBV indicators made of Low Line ~ High Line channels and PVT-MACD oscillator indicators.
The OBV indicator made of Low Line ~ High Line channels is an indicator that can see how the channel is structured, and whether OBV falls below the Low Line of the channel or rises above the High Line.
Therefore, you can predict the future trend based on the channel pattern.
-
The PVT-MACD oscillator indicator is an indicator created by adding the Close value dash PVT value to the MACD formula.
Therefore, it shows a similar appearance to the MACD oscillator indicator.
The reason for looking at the PVT-MACD oscillator indicator is to find out how the trading volume flows.
There are many trading volume indicators, but I think this PVT-MACD oscillator indicator reflects the trading volume flow well.
-
However, you should look at the support and resistance points where the changes in the movement of the PVT-MACD oscillator indicator, the OBV indicator created by the Low Line ~ High Line channel, and the StochRSI indicator occur.
If the changes in these indicators occur near the DOM(-60), HA-Low, HA-High, and DOM(60) indicator points, it can be of great help in creating a trading strategy.
The DOM(-60) indicator indicates the end point of the low point.
That is, falling below the DOM(-60) indicator means that it has entered the low point range, and there is a high possibility that it will show a full-scale downtrend.
The fact that the HA-Low indicator was created means that it has left the low point range.
That is, if it rises above the HA-Low indicator, it means that there is a high possibility that an uptrend will begin.
However, since the HA-Low indicator is an intermediate value, if it encounters resistance and falls, it is possible that it will show a stepwise downtrend.
Therefore, whether there is support in the DOM(-60) ~ HA-Low range is important.
-
Currently, the OBV indicator created as the Low Line ~ High Line channel has fallen below the Low Line.
Therefore, we need to look at whether the Low Line ~ High Line channel will change to a downtrend channel in the future.
We need to look at whether an 'M'-shaped pattern indicating a trend change occurs.
Since the PVT-MACD oscillator indicator is still below the 0 point, it can be seen that the selling force is dominant.
However, since the oscillator is maintaining an upward trend, you can see that the overall selling pressure is decreasing.
Even so, since it is located near the HA-High indicator, the resistance in the HA-High ~ DOM(60) section is expected to be considerable.
-
Support and resistance points should be drawn on the 1M, 1W, and 1D charts.
This will increase accuracy.
However, since the standard time frame chart for all indicators is a 1D chart, it is most important to check the flow of the 1D chart.
-
You may think it is difficult because you have to look at multiple indicators at once.
The most important thing is to look at the movement when approaching the HA-Low or HA-High indicator.
The reason is that the basic trading strategy is to buy near the HA-Low indicator and sell near the HA-High indicator.
-
Thank you for reading to the end.
I hope you have a successful transaction.
--------------------------------------------------
- Here is a description of the big picture.
(3-year bull market, 1-year bear market pattern)

I will explain more details when the bear market starts.
------------------------------------------------------
Trade active
#BTCUSDT 1MIf you look at the area where the finger is pointing, it seems likely to form an 'M'-shaped pattern.
However, if you look at the StochRSI indicator, you can see that it looks completely different.
Therefore, the movement of the area where the previous finger is pointing and the area where the current finger is pointing may be different.
The OBV indicator of the Low Line ~ High Line channel is showing an upward breakout of the High Line.
However, the PVT-MACD oscillator indicator is falling below the 0 point, indicating that the selling pressure is slightly dominant.
Therefore, it seems likely that the upward trend will continue unless it falls while showing an explosive increase in trading volume.
The area where the arrow is pointing means the StochRSI 50 indicator.
For now, it is expected that the StochRSI 50 indicator will play the role of support and resistance when it leads to an additional decline.
From the current price position, the StochRSI 50 indicator point is at 94172.0.
#1W
On the 1W chart, the week that includes June 23 is the center of the volatility period.
Therefore, this week's movement is likely to affect the future trend.
The 99705.62-104463.99 range corresponds to the high boundary range.
Therefore, in order to rise to the high range, it must rise above 104463.99.
If not, if it falls below 99705.62, it will fall below the high range and there is a high possibility of a downtrend.
Since the M-Signal indicator on the 1W chart is rising at the 99705.62 area, it is likely to pick up the trend again when it eventually meets the M-Signal indicator on the 1W chart.
If it goes down, it is highly likely that it will determine the trend again when it meets the M-Signal indicator of the 1M chart.
At this time, it is important to check whether there is support near the 1st and 2nd sections that were previously indicated.
Looking at the StochRSI 50 indicator point mentioned in the explanation of the 1M chart above, we need to check whether the price can be maintained above the Fibonacci ratio 3.14 (93570.28) on the right.
Before that, the key is whether there is support near the HA-High indicator point of the 1W chart, 99705.62.
#1D
There is the Fibonacci ratio 3.618 (98841.11) point of the first wave near the 99705.62 point.
And below that, the M-Signal indicator of the 1W chart is rising.
Therefore, the 99705.62 point is likely to play an important role as support and resistance.
This volatility period is expected to continue until June 23.
However, the volatility period of the 1W chart is the central week of this week's volatility period, so be careful when trading.
The next volatility period is expected to be around July 4 (July 3-5).
Therefore, it seems likely that a mid- to long-term trend will be formed based on this week's movement.
#15m
Now that we have identified the prerequisite movement, we need to create a trading strategy by looking at the actual trading chart to see how to trade.
The key to the trading strategy is the trend of the 1D chart.
The key is how to trade on the actual trading chart and trade according to the trend of the 1D chart.
The indicators that indicate the high point are DOM (60), StochRSI 80, and HA-High.
The indicators that indicate the low point are DOM(-60), StochRSI 20, and HA-Low.
The basic trading strategy is to buy near the HA-Low indicator and sell near the HA-High indicator.
In other words, buy near the indicator that indicates the low point and sell near the indicator that indicates the high point.
The trend is likely to be formed when it meets the HA-Low and HA-High indicators, so you can think of it as the basis for the basic trading strategy.
The DOM(60) indicator that indicates the current high point has been created.
Therefore, you can start trading depending on whether there is support near the DOM(60) indicator.
When you meet the indicators like this, you can refer to and interpret the movements of the auxiliary indicators below to confirm the movement.
Since the PVT-MACD oscillator is located above the 0 point, you can see that the buying force is dominant.
The OBV indicator, which consists of the Low Line ~ High Line channel, is located near the High Line.
Therefore, if the current movement is maintained, the current price decline can be interpreted as likely to be fake.
Therefore, it is recommended to wait until support is confirmed near the DOM (60) indicator.
Even if it declines in a different direction than expected, there is no problem because no transaction was made.
In addition, since the HA-Low indicator is located below, the possibility of finding a better buying point will increase.
Note
I think that the occurrence of a gap in USDT or USDC allows us to know whether funds are flowing into or out of the coin market.
In other words, if a gap rises, it is a trace of funds flowing into the coin market, and if a gap falls, it is a trace of funds flowing out.
I think the current movement of funds is fine.
To see how the funds flowing into the coin market actually move, you need to look at BTC dominance and USDT dominance.
BTC dominance allows us to know whether funds are concentrated toward BTC or altcoins.
In other words, an increase in BTC dominance means that funds are concentrated toward BTC.
This means that you can't tell if the BTC price is going up or down with BTC dominance.
In order for funds to be concentrated in altcoins and for an altcoin bull market to begin, BTC dominance must fall below 55.01 and be maintained or continue to fall.
If it continues to rise, BTC dominance is expected to rise to around the circle indicated on the chart.
The fund that has a big influence on the coin market is USDT.
That's because many markets are operated by exchanges around the world.
I think that USDT dominance is divided into an uptrend and a downtrend based on 4.97.
Therefore, in order for the coin market to continue its uptrend, USDT dominance must be maintained below 4.97 or continue to fall.
If it doesn't and rises above 4.97, the coin market is likely to be in a downtrend.
If USDT dominance continues to rise, it is expected to rise to around 7.14.
However, it is important to see whether there is support near the Fibonacci ratio of 0.618.
If USDT dominance falls, it is expected to fall to around 2.84 at the most.
In other words, by the end of this year, 2025, USDT dominance is expected to fall to around 2.84, ending the long-awaited bull market.
Note
#BTCUSDT.P 15mThe basic trading strategy is to buy near the HA-Low indicator and sell near the HA-High indicator.
However, since the HA-Low and HA-High indicators are intermediate values, there is a possibility that they will move in the opposite direction depending on the support.
In other words, if the HA-Low indicator is resisted and falls, there is a possibility that a stepwise downtrend will occur, and if the HA-High indicator is supported and rises, there is a possibility that a stepwise uptrend will occur.
To determine this, you should refer to the movement of the auxiliary indicator PVT-MACD oscillator indicator and the OBV indicator consisting of the Low Line ~ High Line channel when the HA-Low or HA-High indicator is created and forms a horizontal line.
To understand this, you need to invest a long time to check the movement and increase reliability.
The reason is that since it is an indicator created by someone else, if it is not reliable, it is likely to be ignored when starting a transaction.
If you give up the idea of buying at a lower price or selling at a higher price, you will be able to trade with peace of mind.
Note
#BTCUSDTIt is showing an upward trend on the last day of this volatility period.
However, we need to check whether the price can be maintained by rising above the M-Signal indicator on the 1D chart.
If not, it is likely to face resistance near 104463.99 and fall.
The OBV indicator of the Low LIne ~ High Line channel has formed a downward channel.
Therefore, we need to check whether the OBV can rise above the High Line.
We need to check whether the PVT-MACD oscillator indicator rises above the 0 point when a new candle is created.
If not, we need to interpret that the selling force is still dominant.
In any case, the key is whether it can rise while receiving support between the HA-High indicator point of the 1W chart at 99705.62 and the DOM (60) indicator point of the 1W chart at 104463.99.
Since the point above 104463.99 on the 1W chart is the high point range, in order to continue the uptrend from a medium-term perspective, the price must rise above the DOM (60) indicator and maintain its price.
Since the HA-High indicator is an average value, the HA-High ~ DOM (60) range can be called the high point boundary range.
Therefore, the point where the decline begins in the high point range should be considered the HA-High indicator.
The next period of volatility is expected to be around July 2 (July 1-3) due to a change in trend.
However, since there is a period of volatility around July 7th and July 10th, you should consider the period as July 1st-11th at the most and think about how to respond.
Other content (coins, stocks, etc.) is frequently posted on X.
X에 다른 내용(코인, 주식 등)이 자주 게시.
◆ t.me/readCryptoChannel
[HA-MS Indicator]
bit.ly/3YxHgvN
[OBV Indicator]
bit.ly/4dcyny3
X에 다른 내용(코인, 주식 등)이 자주 게시.
◆ t.me/readCryptoChannel
[HA-MS Indicator]
bit.ly/3YxHgvN
[OBV Indicator]
bit.ly/4dcyny3
Related publications
Disclaimer
The information and publications are not meant to be, and do not constitute, financial, investment, trading, or other types of advice or recommendations supplied or endorsed by TradingView. Read more in the Terms of Use.