Hi traders and investors!
This analysis is based on the Initiative Analysis concept (IA).
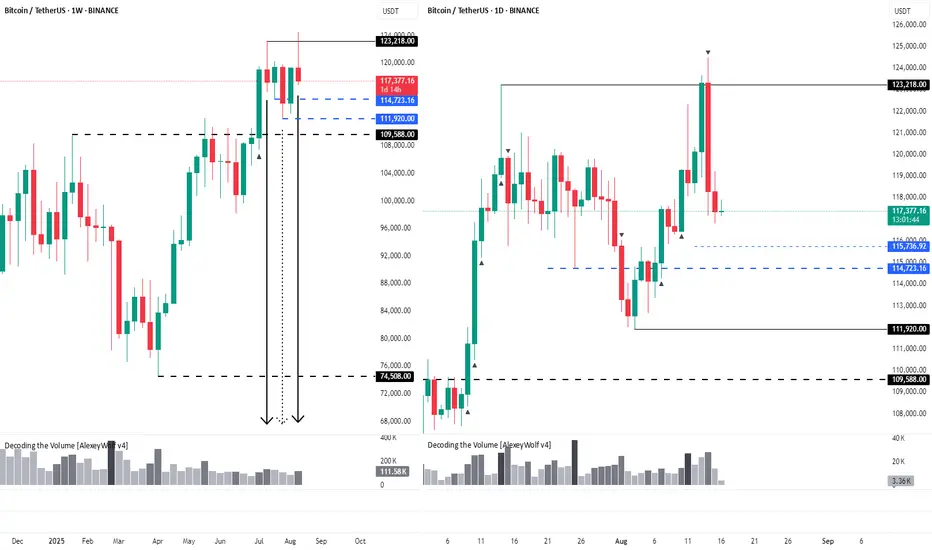
On the weekly timeframe, there was a sideways range (boundaries marked with black lines) that the buyer broke to the upside, but so far has been unable to extend the initiative further. Sellers are still defending the 123,000 level — we can see this from the volume that appears whenever price touches this zone.
On the weekly chart, there’s also the 114,723 level, where price interacted with a seller candle on declining volume. That’s not a bullish signal for looking at longs and suggests price may move lower. If 114,723 doesn’t hold, we could see a retest of the local low at 111,920.
On the daily timeframe, price has formed a sideways range (boundaries marked with black lines).
The current vector is with the sellers, with a target at 115,736.
We’ll be watching how price reacts at 115,736 and at 114,723 — and whether a strong buyer appears at these levels.
Wishing you profitable trades!
This analysis is based on the Initiative Analysis concept (IA).
On the weekly timeframe, there was a sideways range (boundaries marked with black lines) that the buyer broke to the upside, but so far has been unable to extend the initiative further. Sellers are still defending the 123,000 level — we can see this from the volume that appears whenever price touches this zone.
On the weekly chart, there’s also the 114,723 level, where price interacted with a seller candle on declining volume. That’s not a bullish signal for looking at longs and suggests price may move lower. If 114,723 doesn’t hold, we could see a retest of the local low at 111,920.
On the daily timeframe, price has formed a sideways range (boundaries marked with black lines).
The current vector is with the sellers, with a target at 115,736.
We’ll be watching how price reacts at 115,736 and at 114,723 — and whether a strong buyer appears at these levels.
Wishing you profitable trades!
Wishing you profitable trades!
Clarity on the Chart. Smart Trading Decisions.
No signals. Just clean structure and context t.me/user_friendly_trading
Clarity on the Chart. Smart Trading Decisions.
No signals. Just clean structure and context t.me/user_friendly_trading
Related publications
Disclaimer
The information and publications are not meant to be, and do not constitute, financial, investment, trading, or other types of advice or recommendations supplied or endorsed by TradingView. Read more in the Terms of Use.