📊 Bitcoin Technical Analysis – Bullish Flag or Symmetrical Triangle?
📅 Analysis Date: July 29, 2025
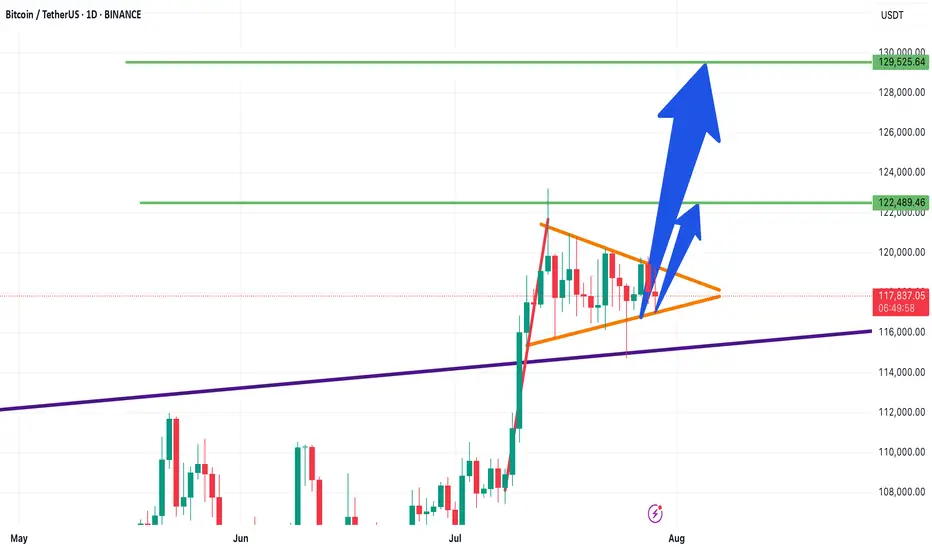
As shown in the chart, Bitcoin appears to be forming a bullish flag or symmetrical triangle pattern—often seen after strong upward moves.
🔹 Bullish Scenario:
If the price breaks above the triangle, the first target is around $122,480, followed by a potential second target near $129,500, based on the length of the flagpole.
🔹 Bearish Scenario:
If the triangle breaks to the downside, the first support to watch is $115,230.
🧭 These key levels act as critical zones of supply and demand, so be sure to keep them on your chart!
🔥 Follow me for real-time setups, clear signals, and expert technical analysis!
📅 Analysis Date: July 29, 2025
As shown in the chart, Bitcoin appears to be forming a bullish flag or symmetrical triangle pattern—often seen after strong upward moves.
🔹 Bullish Scenario:
If the price breaks above the triangle, the first target is around $122,480, followed by a potential second target near $129,500, based on the length of the flagpole.
🔹 Bearish Scenario:
If the triangle breaks to the downside, the first support to watch is $115,230.
🧭 These key levels act as critical zones of supply and demand, so be sure to keep them on your chart!
🔥 Follow me for real-time setups, clear signals, and expert technical analysis!
Disclaimer
The information and publications are not meant to be, and do not constitute, financial, investment, trading, or other types of advice or recommendations supplied or endorsed by TradingView. Read more in the Terms of Use.
Disclaimer
The information and publications are not meant to be, and do not constitute, financial, investment, trading, or other types of advice or recommendations supplied or endorsed by TradingView. Read more in the Terms of Use.