As the broader Cryptomarket has bled through the last couple of days, I noticed something.
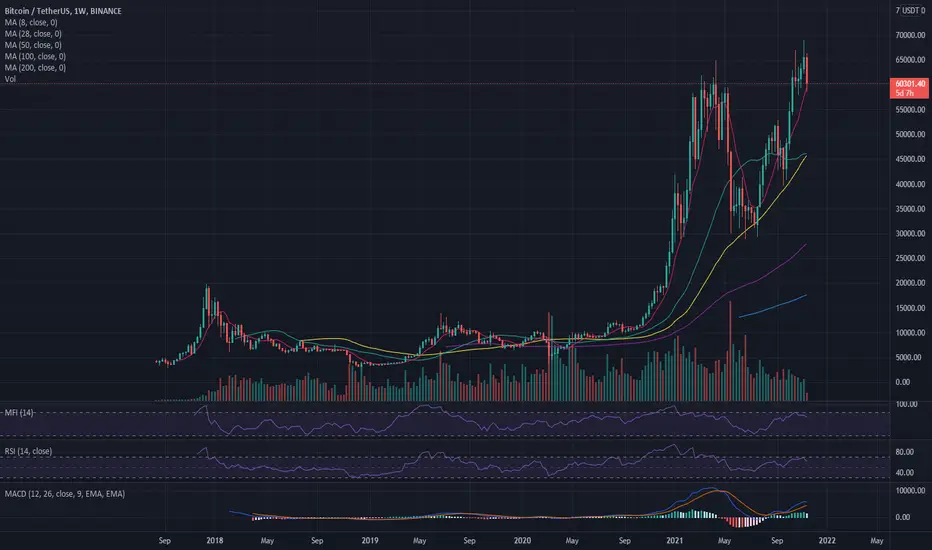
On the weekly BTCUSDT chart, the 28MA and 50MA are converging, and if BTC bleeds for another week or two it looks like they might cross.
28 weeks ago BTC was trading around $58,000 , and the next week BTC started the big dump of last summer.
50 weeks ago BTC was trading around $18,750, and two weeks later BTC started it's big breakout to new ATH's.
This simply means that the 50MA will start to move higher faster, while there's a big chance the 28MA will fall, especially if BTC were to bleed further in the coming weeks.
I'm not saying this has to be the end of this market cycle, but since january 2012 the 50MA hasn't crossed the 28MA without a major bear market following after.
With the volume also steadily decreasing in the last couple of weeks, it doesn't seem like momentum is in the bulls favor.
Looking at BTC's dominance, it seems like BTC.D is looking to break-out, which would make sense in the event of broader market downside.
I think BTC will touch the bullmarket support band in the coming days, which currently is just around $52,000 , but what's more interesting is where we will close this week.
Disclaimer
The information and publications are not meant to be, and do not constitute, financial, investment, trading, or other types of advice or recommendations supplied or endorsed by TradingView. Read more in the Terms of Use.
Disclaimer
The information and publications are not meant to be, and do not constitute, financial, investment, trading, or other types of advice or recommendations supplied or endorsed by TradingView. Read more in the Terms of Use.