Bitcoin prices often find support from moving averages during pullbacks. When the price retreats to a key moving average (such as the 100-day moving average) and the average effectively supports the price, along with signs of stabilization like K-lines with long lower shadows or trading volume shrinking before expanding again, it presents a good opportunity to add long positions. This indicates that bullish momentum remains strong during the correction, as market participants are unwilling to let the price break below the key support level, making it likely that the upward trend will continue.
From a technical indicator perspective, both the MACD and KDJ indicators have issued potential bullish signals. When the DIF line in the MACD indicator crosses above the DEA line to form a "golden cross," and the histogram turns from green to red while gradually increasing, it strongly signals that bullish momentum is strengthening and prices have upward momentum. Additionally, when the KDJ indicator forms a golden cross at low levels (values below 20), it similarly suggests that prices may soon rebound. These technical indicators mutually confirm each other, providing a technical basis for opening long positions and helping investors better identify turning points in price trends.
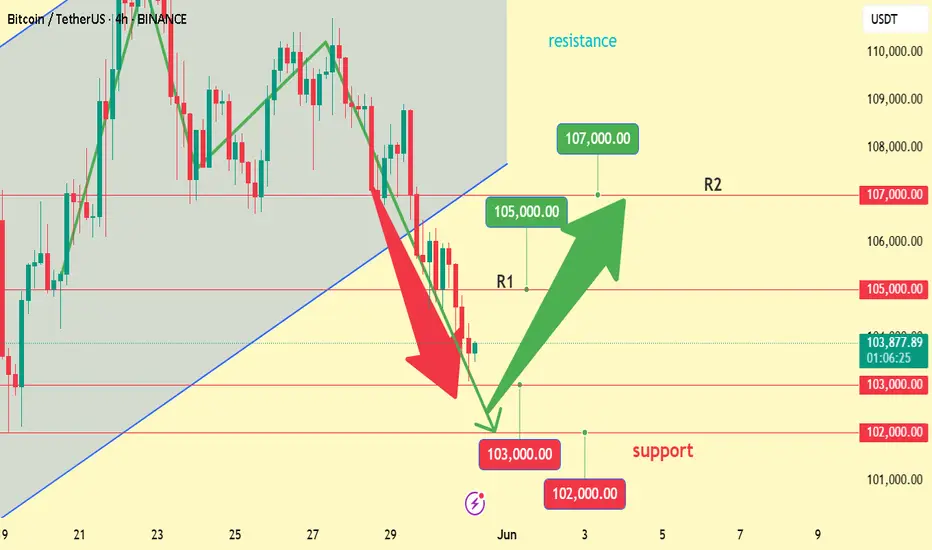
Today's BTC trading strategy, I hope it will be helpful to you
BTCUSDT BUY@102000~103000
SL:101000
TP:105000~107000
From a technical indicator perspective, both the MACD and KDJ indicators have issued potential bullish signals. When the DIF line in the MACD indicator crosses above the DEA line to form a "golden cross," and the histogram turns from green to red while gradually increasing, it strongly signals that bullish momentum is strengthening and prices have upward momentum. Additionally, when the KDJ indicator forms a golden cross at low levels (values below 20), it similarly suggests that prices may soon rebound. These technical indicators mutually confirm each other, providing a technical basis for opening long positions and helping investors better identify turning points in price trends.
Today's BTC trading strategy, I hope it will be helpful to you
BTCUSDT BUY@102000~103000
SL:101000
TP:105000~107000
Trade active
If you feel the profit is enough, you can close the transaction earlyDisclaimer
The information and publications are not meant to be, and do not constitute, financial, investment, trading, or other types of advice or recommendations supplied or endorsed by TradingView. Read more in the Terms of Use.
Disclaimer
The information and publications are not meant to be, and do not constitute, financial, investment, trading, or other types of advice or recommendations supplied or endorsed by TradingView. Read more in the Terms of Use.