Bitcoin Technical Analysis | August 7, 2025
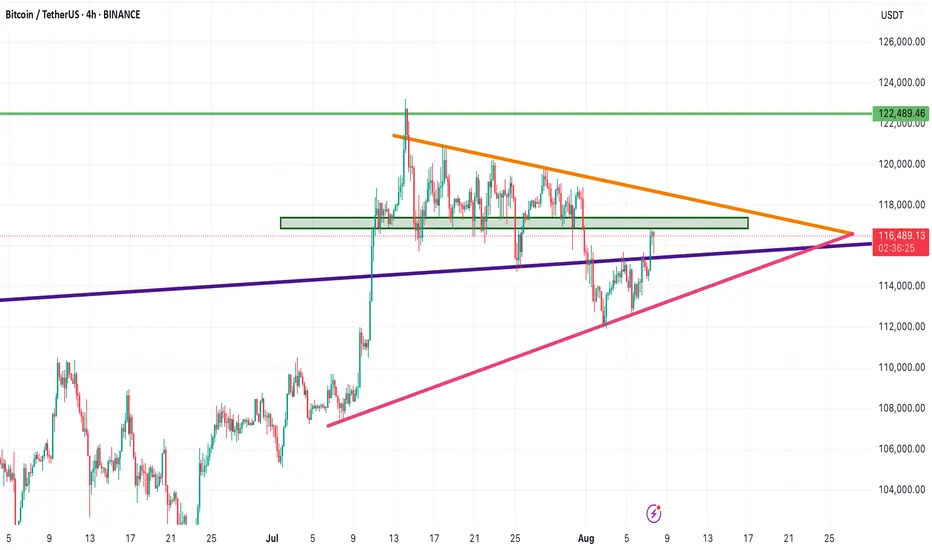
After a corrective move to the $112,000 support zone, Bitcoin bounced back and is now moving along a rising trendline (highlighted in pink). As long as the price holds above this line, the bullish structure remains intact.
🔸 Currently, BTC is approaching a key resistance zone between $117,500 and $118,600, which aligns with the descending orange trendline on the chart. If this zone is broken with confirmation, the next potential targets will be:
$122,400
and $129,500
🔻 However, if the price gets rejected from this resistance:
The first support lies at $115,570
Breaking below that, the next support will be the purple trendline
A confirmed break of the bullish structure could push BTC down to $110,524
📌 Conclusion:
Bitcoin is nearing the apex of a symmetrical triangle pattern. A breakout in either direction could define the next major move. Make sure to mark these critical levels on your chart and adjust your trading strategy accordingly.
Disclaimer
The information and publications are not meant to be, and do not constitute, financial, investment, trading, or other types of advice or recommendations supplied or endorsed by TradingView. Read more in the Terms of Use.
Disclaimer
The information and publications are not meant to be, and do not constitute, financial, investment, trading, or other types of advice or recommendations supplied or endorsed by TradingView. Read more in the Terms of Use.