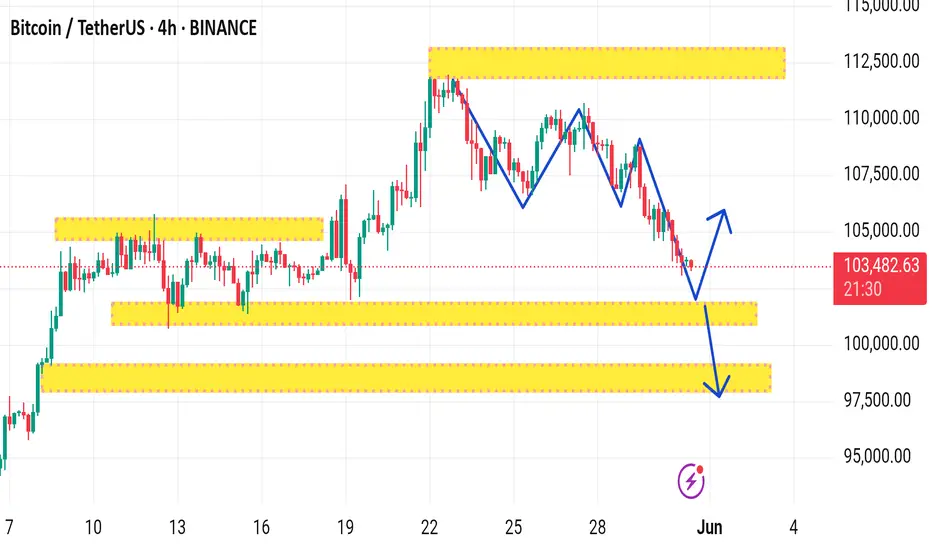
This chart shows a technical analysis of the BTC/USDT (Bitcoin/US Dollar Tether) pair on the 4-hour timeframe using Binance data. Here's a detailed breakdown of the key elements:
Current Price:
BTC is trading at $103,439.50, down 0.53% on the 4-hour chart.
Highlighted Zones (Yellow Boxes):
These are likely support and resistance zones:
1. Resistance zone near $112,000 – This is the recent high and potential sell zone.
2. Support zone around $101,000–102,000 – This could act as the first level of buying interest.
3. Stronger support zone between $97,000–99,000 – Key demand area if the price drops further.
4. Mid-range zone around $104,000–105,000 – Previous consolidation area which could act as a minor resistance/support flip.
Blue Zigzag Line:
This illustrates a potential head and shoulders pattern, followed by a projected price movement:
A possible bounce from the $101,000 area back toward $105,000.
If that fails, a bearish continuation toward the lower support zone near $97,000.
Implications:
Short-term Bearish Bias: The overall pattern suggests potential further downside unless BTC holds the current support area.
Reversal Potential: A successful bounce at current levels could lead to a relief rally.
Key Levels to Watch:
Break below ~$101,000 could open the way to ~$97,000.
Break above ~$105,000–106,000 may indicate a shift back to bullish momentum.
Would you like a deeper technical analysis or recommendations based on this setup (e.g., risk/reward, entry/exit ideas)?
Disclaimer
The information and publications are not meant to be, and do not constitute, financial, investment, trading, or other types of advice or recommendations supplied or endorsed by TradingView. Read more in the Terms of Use.
Disclaimer
The information and publications are not meant to be, and do not constitute, financial, investment, trading, or other types of advice or recommendations supplied or endorsed by TradingView. Read more in the Terms of Use.