Hello, traders!
Follow us to get the latest information quickly.
Have a great day!
-------------------------------------
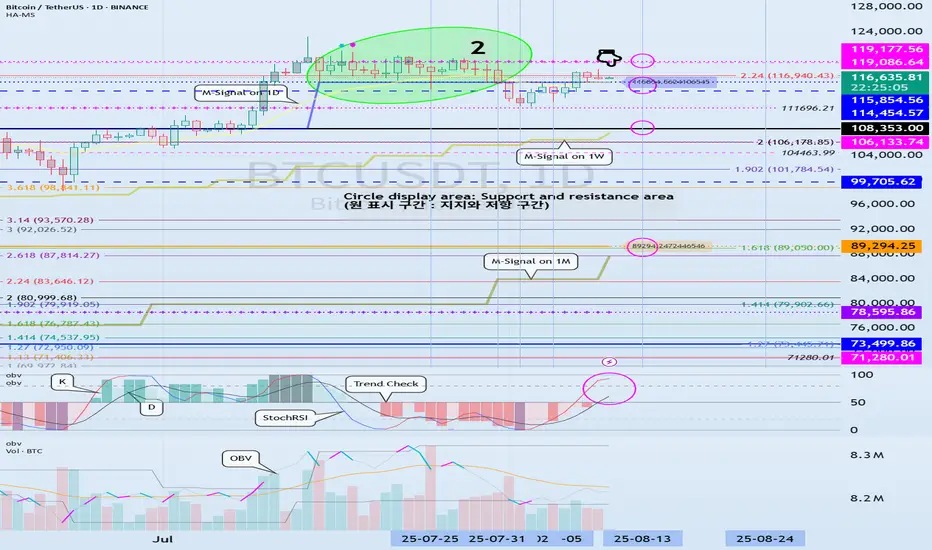
(BTCUSDT 1D Chart)
The K indicator on the StochRSI indicator appears to have entered the overbought zone, leading to a change in slope.
Therefore, the upward trend appears likely to be constrained.
-
We need to confirm whether the price falls within the range indicated by the index finger.
The key question is whether there is support around 114454.57-115854.56.
If it declines, it is likely to continue until it meets the M-Signal indicator on the 1W chart.
At this point, we need to check for support around 108353.0.
This period of volatility is expected to occur around August 13th (August 12th-14th).
The start of a stepwise uptrend is likely to occur only after it rises above 119177.56.
-
Thank you for reading to the end.
We wish you successful trading.
--------------------------------------------------
- This is an explanation of the big picture.
(3-year bull market, 1-year bear market pattern)

I will explain in more detail when the bear market begins.
------------------------------------------------------
Trade active
#BTCUSDTTo initiate a cascading uptrend, the price must remain above 119,177.56.
Once the cascading uptrend begins, the Fibonacci ratio 2.618 (133,889.92) is expected to be the final target area in 2025.
A period of volatility will begin around August 13 (August 12-14).
The key will be whether the price can find support around 119,177.56 and then rise.
If the price fails to rise, it will need to check for support around 114,454.57-115,854.56.
This is because the downtrend is likely to begin with a drop below the 114454.57-115854.56 range.
Since the TC (Trend Check) indicator is above zero, we can assume that buying pressure is dominant.
Therefore, we should be wary of fakes during this period of volatility.
Unless an arrow signal indicating that the price has reached its peak, we believe further upward movement is highly likely.
However, the upward movement may be limited because the K indicator in the StochRSI indicator is showing a change in slope within the overbought zone.
Other content (coins, stocks, etc.) is frequently posted on X.
X에 다른 내용(코인, 주식 등)이 자주 게시.
◆ t.me/readCryptoChannel
[HA-MS Indicator]
bit.ly/3YxHgvN
[OBV Indicator]
bit.ly/4dcyny3
X에 다른 내용(코인, 주식 등)이 자주 게시.
◆ t.me/readCryptoChannel
[HA-MS Indicator]
bit.ly/3YxHgvN
[OBV Indicator]
bit.ly/4dcyny3
Related publications
Disclaimer
The information and publications are not meant to be, and do not constitute, financial, investment, trading, or other types of advice or recommendations supplied or endorsed by TradingView. Read more in the Terms of Use.