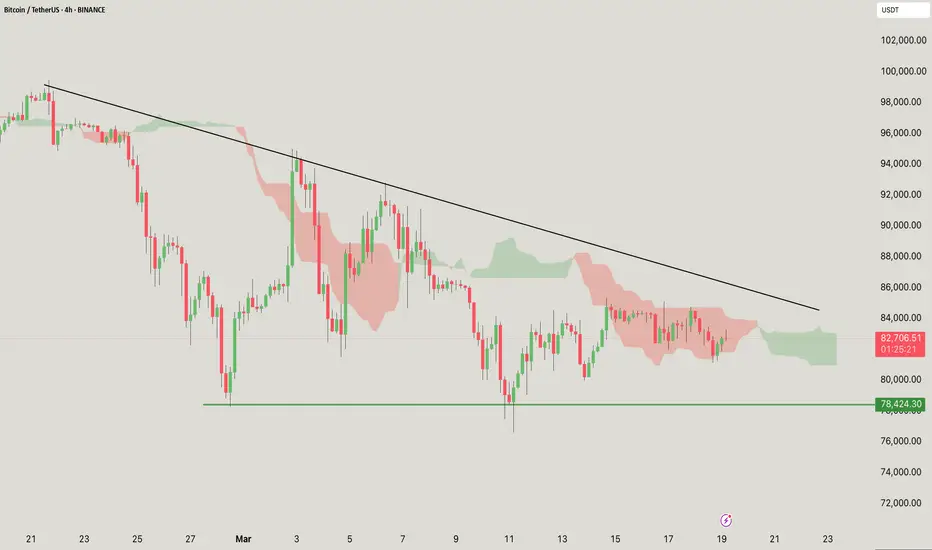
Price: Currently around $82,753.16, showing a slight increase of +0.05%.
Trend line: A descending trend line is visible, indicating potential resistance. If the price breaks above this line, it could signal a bullish reversal.
Support level: There is a strong support level at $78,424.30, which has been tested multiple times.
Indicators: The price is currently in the cloud, indicating a state of indecision. The green cloud above indicates potential resistance, while the red cloud below indicates previous bearish momentum.
Resistance: Keep an eye on the descending trend line and the upper edge of the cloud.
Support: The $78,424 level acts as a crucial support area.
Monitor breakouts: A breakout above the trend line may indicate an uptrend, while a breakdown below the support level may signal a further decline.
Volume analysis: Monitor trading volume to confirm breakouts.
If you found this analysis helpful, hit the Like button and share your thoughts or questions in the comments below. Your feedback matters!
Thanks for your support!
DYOR. NFA
Related publications
Disclaimer
The information and publications are not meant to be, and do not constitute, financial, investment, trading, or other types of advice or recommendations supplied or endorsed by TradingView. Read more in the Terms of Use.
Related publications
Disclaimer
The information and publications are not meant to be, and do not constitute, financial, investment, trading, or other types of advice or recommendations supplied or endorsed by TradingView. Read more in the Terms of Use.