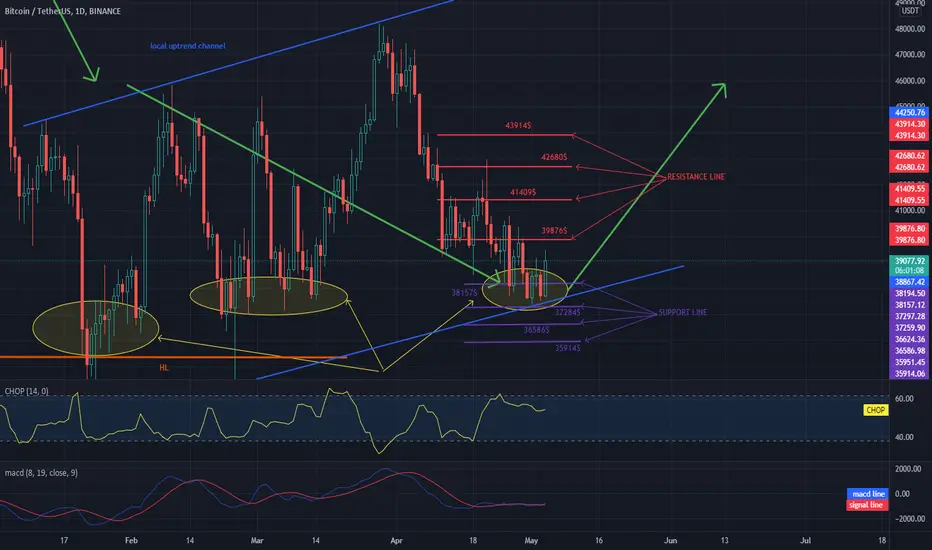
Hello everyone, let's take a look at the BTC to USDT chart over the 1 day timeframe. As you can see, the price is moving in the uptrend channel.
Let's start with the designation of the support line and as you can see the first support in the near future is $ 38,157, if the support collapses, the next ones are $ 37,284 and $ 36,586 and $ 35,914.
Now let's move from the resistance line as you can see the first resistance is $ 39,876, if you can break it the next resistance will be $ 41,409 and $ 42,680 plus $ 43,914.
Looking at the CHOP indicator, we can see that in the 1-day interval, despite the last move up, we have a lot of energy.
It is also worth paying attention to the MACD indicator, which indicates that the blue line has crossed the red line from the bottom, which may indicate the beginning of an uptrend.
Disclaimer
The information and publications are not meant to be, and do not constitute, financial, investment, trading, or other types of advice or recommendations supplied or endorsed by TradingView. Read more in the Terms of Use.
Disclaimer
The information and publications are not meant to be, and do not constitute, financial, investment, trading, or other types of advice or recommendations supplied or endorsed by TradingView. Read more in the Terms of Use.