Bitcoin has shown signs and patterns in the daily time frame that can be analyzed with the current data.
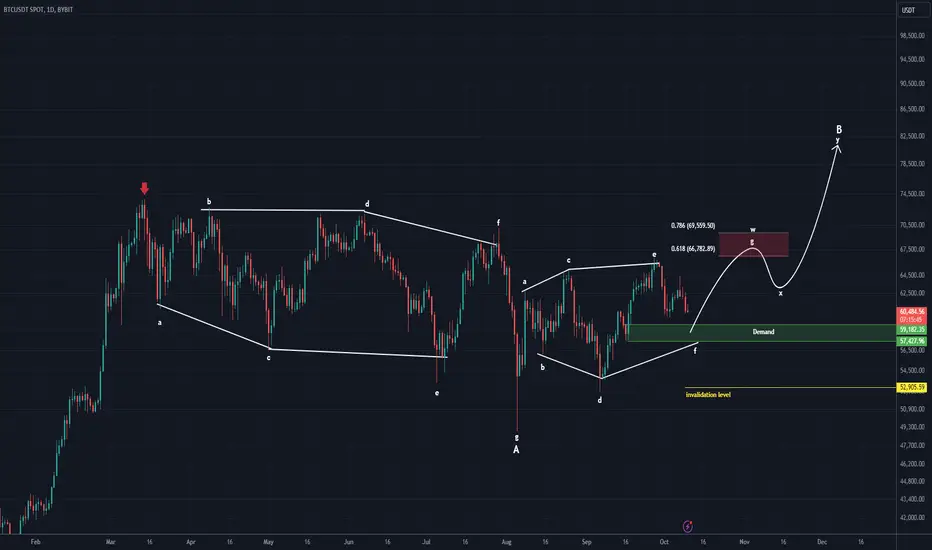
It looks like a diametric has finished (A) and then the price has entered a bullish phase.
In the bullish phase, we have an ABC/WXY whose A/W has the signs of a diamond diametric.
We expect waves X and Y because the time of wave A is much larger than the current pattern (A/W).
The green range could be the start of a bull run in Bitcoin.
Closing a daily candle below the invalidation level will violate the analysis.
Note : This is only a possible scenario, please do not forget to manage risk
For risk management, please don't forget stop loss and capital management
Comment if you have any questions
Thank You
Trade active
Description is very important (read) :Bitcoin has now reached the red zone.
Bitcoin can pump up to 72K and then arrange its median correction. (from 67k to 72k is the supply range).
After a correction towards 55800-52800, it can attack towards 80k areas.
For now, we have this view.
Note
We correct these numbers:After a correction towards 64500 - 62800, it can attack towards 80k areas.
Trade closed: target reached
This Bitcoin move was well done🔆To succeed in trading, just enter our Telegram channel:
Free membership: t.me/Behdark_EN
🔷Our Telegram channel has daily spot and futures signals 👉 t.me/Behdark_EN
💎 Exclusive signals are only shared on our Telegram channel
Free membership: t.me/Behdark_EN
🔷Our Telegram channel has daily spot and futures signals 👉 t.me/Behdark_EN
💎 Exclusive signals are only shared on our Telegram channel
Disclaimer
The information and publications are not meant to be, and do not constitute, financial, investment, trading, or other types of advice or recommendations supplied or endorsed by TradingView. Read more in the Terms of Use.
🔆To succeed in trading, just enter our Telegram channel:
Free membership: t.me/Behdark_EN
🔷Our Telegram channel has daily spot and futures signals 👉 t.me/Behdark_EN
💎 Exclusive signals are only shared on our Telegram channel
Free membership: t.me/Behdark_EN
🔷Our Telegram channel has daily spot and futures signals 👉 t.me/Behdark_EN
💎 Exclusive signals are only shared on our Telegram channel
Disclaimer
The information and publications are not meant to be, and do not constitute, financial, investment, trading, or other types of advice or recommendations supplied or endorsed by TradingView. Read more in the Terms of Use.