Hello, traders.
If you "Follow", you can always get the latest information quickly.
Have a nice day today.
-------------------------------------
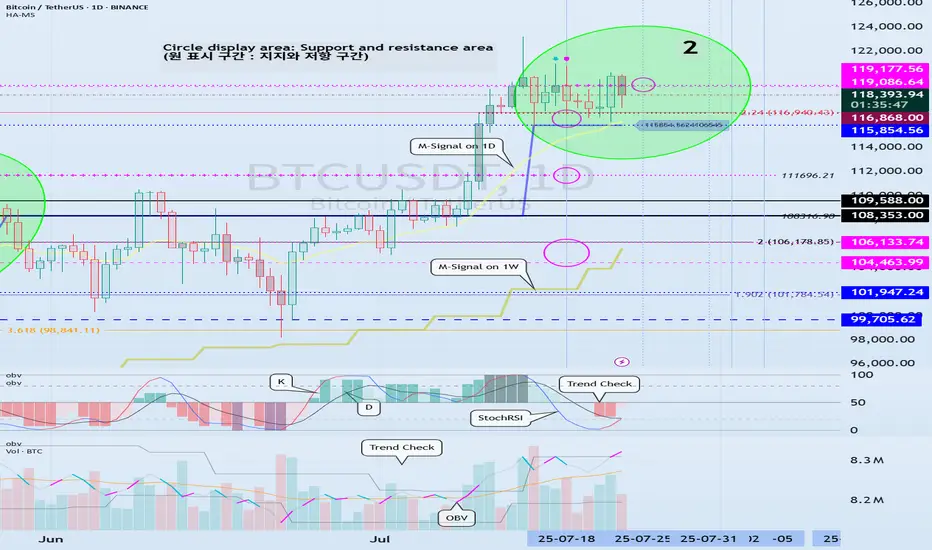
(BTCUSDT 1D chart)
BTC is in a step up trend.
Looking at the bigger picture, it can be seen that it is in the second step up trend.
The important volatility period in this step-up is expected to be around August 2-5 (up to August 1-6).
Therefore, we need to look at what kind of movement it makes as it passes through the previous volatility period of around July 25 (July 24-26) and around July 31 (July 30-August 1).
In other words, we need to check which section is supported and which section is resisted, and see if it breaks through that section.
What we can see now is that it is checking whether there is support in the 115854.56-119086.64 section, that is, the HA-High ~ DOM (60) section.
Since the M-Signal indicator on the 1D chart has risen to the 115854.56 point, the key is whether it can receive support at the 115854.56 point and rise.
If it falls below the M-Signal indicator of the 1D chart and shows resistance, it is likely to meet the M-Signal indicator of the 1W chart.
This flow is an interpretation of the separation learned when studying the price moving average.
Therefore, we can see that the maximum decline point is when it meets the M-Signal indicator of the 1M chart.
-
Industries (coins, tokens) that are renewing the ATH are actually outside the predictable range.
Therefore, we should think of it as a situation where it is not strange whether it falls or rises at any time and think of a response plan.
Since it is currently within the predictable range, we can create a response strategy by checking whether there is support in the 115854.56-119086.64 section.
However, as I mentioned earlier, the volatility period is about to begin, so caution is required when making new transactions.
That is, you need to check whether it breaks out of the 115854.56-119086.64 range during the volatility period that continues until July 26.
And if it breaks out, you need to check whether it is supported or resisted in that area and respond accordingly.
-
The OBV indicator of the Low Line ~ High Line channel is showing a pattern of rising above the High Line.
Accordingly, if the OBV indicator is maintained above the High Line, it is expected to show an additional rise.
In accordance with this, you need to check whether the K of the StochRSI indicator shows a movement to rise in the oversold range and a transition to a state where K > D.
You also need to check whether the TC (Trend Check) indicator continues its upward trend and can rise above the 0 point.
If these conditions are met, it is expected that BTC will rise above 119086.64 or show a pattern of rising.
-
This decline created a low trend line, creating a perfect rising channel.
Therefore, we need to see how far we can go up along the rising channel created this time.
In that sense, we should pay close attention to the movement during the volatility period around July 25th (July 24-26).
-
Thank you for reading to the end.
I hope you have a successful trade.
--------------------------------------------------
- This is an explanation of the big picture.
(3-year bull market, 1-year bear market pattern)

I will explain more details when the bear market starts.
------------------------------------------------------
Trade active
#BTCUSDTIt is showing a decline to around 115854.56 during the volatility period.
This volatility period is expected to continue until July 26th.
However, since the important volatility period is around August 2nd-5th, we need to keep an eye on the future movement.
The 115854.56 point is the HA-High indicator point.
Accordingly, if it encounters resistance at the HA-High indicator and falls, it is likely to fall until it meets the HA-Low indicator.
Therefore, whether there is support near 115854.56 is an important issue.
Since the M-Signal indicator on the 1D chart is passing around 115854.56, its significance is even more significant.
If it continues to fall, we need to check whether there is support near 111696.21, which was the previous high point.
If not, we need to check whether there is support near 108353.0-109588.0, which was the previous ATH point.
The basic trading strategy is to buy in the DOM(-60) ~ HA-Low section and sell in the HA-High ~ DOM(60) section.
However, if it rises in the HA-High ~ DOM(60) section, it is likely to show a stepwise upward trend, and if it falls in the DOM(-60) ~ HA-Low section, it is likely to show a stepwise downward trend.
As I mentioned in the text, it seems that the test is currently underway to see if the second calculation can continue the upward trend, so this support is likely to create an important turning point.
I think the target point for 2025 is around the Fibonacci ratio 2.618 (133889.92).
If it shows a strong upward trend, it seems possible that it will temporarily touch the Fibonacci ratio 3 (151018.77) ~ 3.14 (157296.39) and then plunge.
The most important question is whether BTC can maintain this upward trend and thus start an altcoin bull market.
I think that for an altcoin bull market to start, BTC dominance must fall below 55.01-62.47 and remain there or continue to decline.
Therefore, it cannot be said that an altcoin bull market has started at the moment.
USDT dominance must remain below 4.91 or continue to decline for the entire coin market to likely rise.
However, USDT Dominus is likely to fall to around 2.84, and the coin market is expected to start a major bear market after a sharp rise thereafter.
Note
#BTCUSDT 1DThis volatility period is expected to continue until August 26.
However, the important volatility period is around August 2-5, so we need to look at the movement until then.
The key is whether it can receive support and rise in the 115854.56-119086.64 range.
Since the indicators on the 1D chart, namely StochRSI, Trend Check, and OBV indicators, are all showing a downward trend, it is important to see whether there is support near 115854.56.
#30m
Looking at the 30m chart, it appears to be turning into an upward trend as it rises above 116868.0.
HA-High ~ DOM(60) section is formed around 119086.64, so if it continues to rise further, it is possible that it will rise to around 119086.64.
However, if the HA-High and DOM(60) indicators are newly created according to the price movement, it is important whether there is support in that area.
#BTCUSDT.P 15m
When trading spot, I look at the 30m chart, and when trading futures, I look at the 15m chart.
There is no special reason for choosing the 15m chart for futures trading, except for faster trading.
When trading spot, I think that trading too quickly can lead to mistakes in trading, so I chose the 30m chart to check for support and trade.
-
BTC's spot chart and futures chart look slightly different.
On the spot chart, the StochRSI 80 indicator is formed at 116868.0, but on the futures chart, it is formed at 117500.0.
In other words, on the futures chart, it is not yet above the StochRSI 80 point.
Therefore, it seems that it is possible to turn into an uptrend only if it rises above 117500.0 and shows support.
The HA-High indicator and DOM (60) indicator are newly formed.
Therefore, it can be seen that support near 117500.0 is becoming more important.
----------------------------
It is recommended to determine the main position according to the trend of the 1D chart.
In other words, since the current trend of the 1D chart is still in an uptrend, it is recommended to consider buying (LONG) as the main position and proceed with the transaction.'
Therefore, if you need to trade in a direction different from your main position, you should lower your investment weight and remember that short and quick responses are required when trading.
In that sense, you need to be careful when trading with a sell (SHORT) on the 15m chart of futures trading.
Note
#BTCUSDT 1WThe DOM(60) indicator was created at 119086.64.
Therefore, it is necessary to check whether it is supported around 119086.64 this week.
In order for the indicator to play the role of support and resistance, it must remain horizontal for at least 3 candles.
Although the arrangement of candles 1 and 2 are different, the shape is similar, so whether there is support around 119086.64 is important.
The volatility period on the 1W chart is around the week including August 18.
Other content (coins, stocks, etc.) is frequently posted on X.
X에 다른 내용(코인, 주식 등)이 자주 게시.
◆ t.me/readCryptoChannel
[HA-MS Indicator]
bit.ly/3YxHgvN
[OBV Indicator]
bit.ly/4dcyny3
X에 다른 내용(코인, 주식 등)이 자주 게시.
◆ t.me/readCryptoChannel
[HA-MS Indicator]
bit.ly/3YxHgvN
[OBV Indicator]
bit.ly/4dcyny3
Related publications
Disclaimer
The information and publications are not meant to be, and do not constitute, financial, investment, trading, or other types of advice or recommendations supplied or endorsed by TradingView. Read more in the Terms of Use.