
Welcome peeps,
I am solixouss, i started trading about a year ago. i used to watch the charts and the historical data, it realy worked for me.
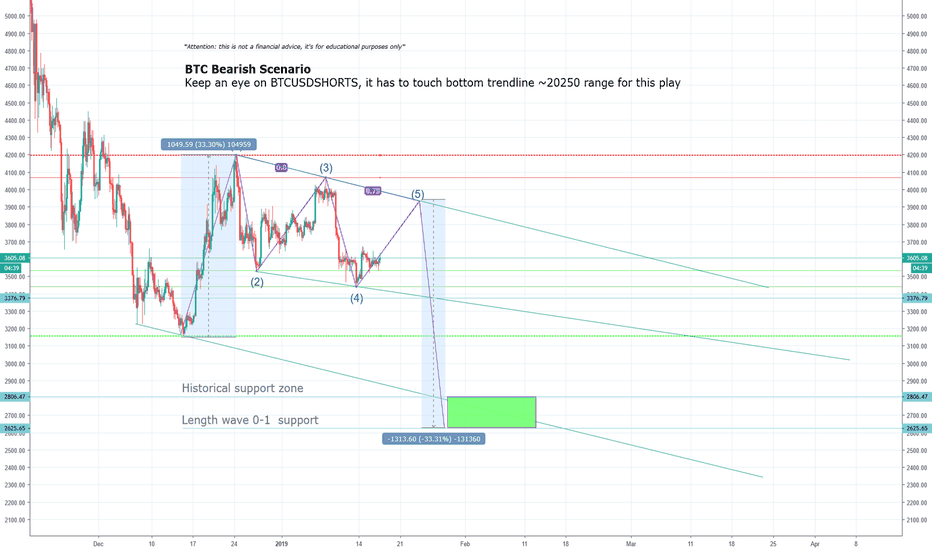
This is my Second TA and i hope it will play out like my first one. I am not sure at all so dont take this as an advice, it's just for educational purposes
I am looking for this play to enter the market, first i think we will make a fakeout to around 3900 range and after that we might see that USDBTCSHORT is dumped to the Bottom trendline range (2300-2500 depends on when this will play out)
Out of historical data you can see that we might see a big selloff at this range..
i have my fingers crossed :)
Comment what you think about this chart please. Tips are welcome
I am solixouss, i started trading about a year ago. i used to watch the charts and the historical data, it realy worked for me.
This is my Second TA and i hope it will play out like my first one. I am not sure at all so dont take this as an advice, it's just for educational purposes
I am looking for this play to enter the market, first i think we will make a fakeout to around 3900 range and after that we might see that USDBTCSHORT is dumped to the Bottom trendline range (2300-2500 depends on when this will play out)
Out of historical data you can see that we might see a big selloff at this range..
i have my fingers crossed :)
Comment what you think about this chart please. Tips are welcome
Note
hit the like button if you expect a selloffNote
I will update this chart, so save it!Note
I will show you the USDBTCSHORT chart with the trendline explained with daily chart.Note
Done! tell me what you think about itNote
Note
Note
I ment range 20200-20500! sorry!Note
also join my telegram channel: t.me/cryptoroutineshoutout to potato t.me/hashedplutus
Note
As i mentioned, we have a fakeout forming up.high resistance at 3900.
Disclaimer
The information and publications are not meant to be, and do not constitute, financial, investment, trading, or other types of advice or recommendations supplied or endorsed by TradingView. Read more in the Terms of Use.
Disclaimer
The information and publications are not meant to be, and do not constitute, financial, investment, trading, or other types of advice or recommendations supplied or endorsed by TradingView. Read more in the Terms of Use.