Looking through my charts in gold, BTC, and cycle influencers I have seen that everybody has an different count in the weekly cycles.
I have overlaid the two popular cycles on top of each others, and believe to have found some interesting patterns.
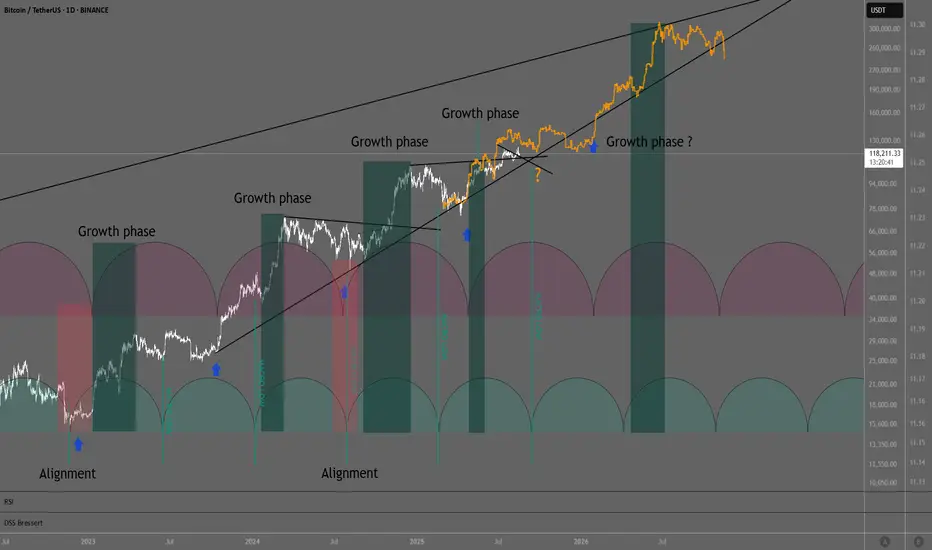
Shortly said the larger red timing cycle is the more dominant cycle, matching all the larger lows. But looking at the green timing cycle count macro lows can be observed. And when comparing the alignment of the two cycles interesting things can be seen.
Example when the weekly cycle moves down and green cycle goes up, price move sideways, and when cycle lows align, big moves down occur. After the alignment lows, the cycle have moved simultaneously toward the cycle crests, and this have given BTC big volatile moves up.
Growth phase happens when both cycles move align from low to crest, here there is a period where more volatile upside is observed, on the other side a volatile negative period can be seen when the cycle lows align, as seen with the FTX collapse that marked the last bear market bottom, and last summer where we was a +30% correction after the ATH before the halving. Looking forward a macro low can be seen mid September, and a larger weekly cycle low January 2026. This is not ideal for a big blow off top. But more of an curved choppy top unfortunately.
Looking at the coming macro low and weekly cycle low in January which can be the end of the cycle, this can be looking very similarly to the start of the cycle ironically. Here we observe that the macro or green cycle bottoms right in the middle of the larger weekly cycle.
The next where both cycle align is October 2026. Is this the next bear market low?
I have overlaid the two popular cycles on top of each others, and believe to have found some interesting patterns.
Shortly said the larger red timing cycle is the more dominant cycle, matching all the larger lows. But looking at the green timing cycle count macro lows can be observed. And when comparing the alignment of the two cycles interesting things can be seen.
Example when the weekly cycle moves down and green cycle goes up, price move sideways, and when cycle lows align, big moves down occur. After the alignment lows, the cycle have moved simultaneously toward the cycle crests, and this have given BTC big volatile moves up.
Growth phase happens when both cycles move align from low to crest, here there is a period where more volatile upside is observed, on the other side a volatile negative period can be seen when the cycle lows align, as seen with the FTX collapse that marked the last bear market bottom, and last summer where we was a +30% correction after the ATH before the halving. Looking forward a macro low can be seen mid September, and a larger weekly cycle low January 2026. This is not ideal for a big blow off top. But more of an curved choppy top unfortunately.
Looking at the coming macro low and weekly cycle low in January which can be the end of the cycle, this can be looking very similarly to the start of the cycle ironically. Here we observe that the macro or green cycle bottoms right in the middle of the larger weekly cycle.
The next where both cycle align is October 2026. Is this the next bear market low?
Disclaimer
The information and publications are not meant to be, and do not constitute, financial, investment, trading, or other types of advice or recommendations supplied or endorsed by TradingView. Read more in the Terms of Use.
Disclaimer
The information and publications are not meant to be, and do not constitute, financial, investment, trading, or other types of advice or recommendations supplied or endorsed by TradingView. Read more in the Terms of Use.