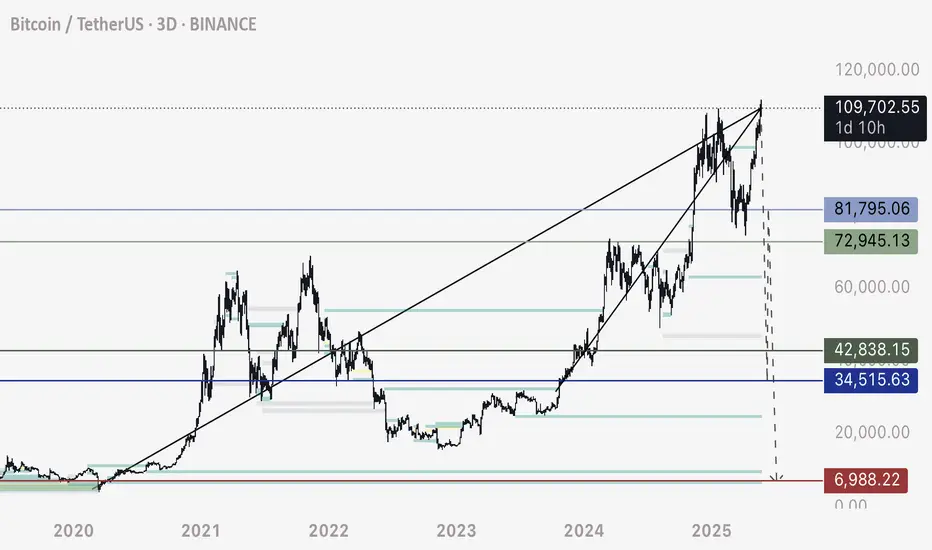
Zooming out on BTC chart we can note this major bearish trendline on the HTF. This diagonal support / resistance line can take BTC to 7,000.
Likely? Maybe not. Possible? Absolutely.
A straight move up on BTC like we have seen the last two years is very dangerous. There is a large chain reaction of leveraged sell orders via long position stop losses cascading down the price levels.
Can this trigger a massive and fast flash crash?
In my view - absolutely.
Here are two potential moves that take price to those low liquidations levels.
Possibility 1
110,000 to 35,000
35,000 retrace to 81,000
81,000 to 7,000
Possibility 2
110,000 to 43,000
43,000 retrace to 72,000
72,000 to 7,000
Note that both of these possibilities end with 7,000. I’m mapping out two routes that take us there, using confluences with trendlines, volume profiles, liquidity mapping, and common sense.
Always remember that crypto is a very new market, with some unique mechanics that differentiate it from other more established markets. Predominantly the futures and high leverage usage and the ways these platforms make their money…
Beware and be prepared.
Disclaimer
The information and publications are not meant to be, and do not constitute, financial, investment, trading, or other types of advice or recommendations supplied or endorsed by TradingView. Read more in the Terms of Use.
Disclaimer
The information and publications are not meant to be, and do not constitute, financial, investment, trading, or other types of advice or recommendations supplied or endorsed by TradingView. Read more in the Terms of Use.