Hello, traders.
Please "Follow" to get the latest information quickly.
Have a nice day today.
-------------------------------------
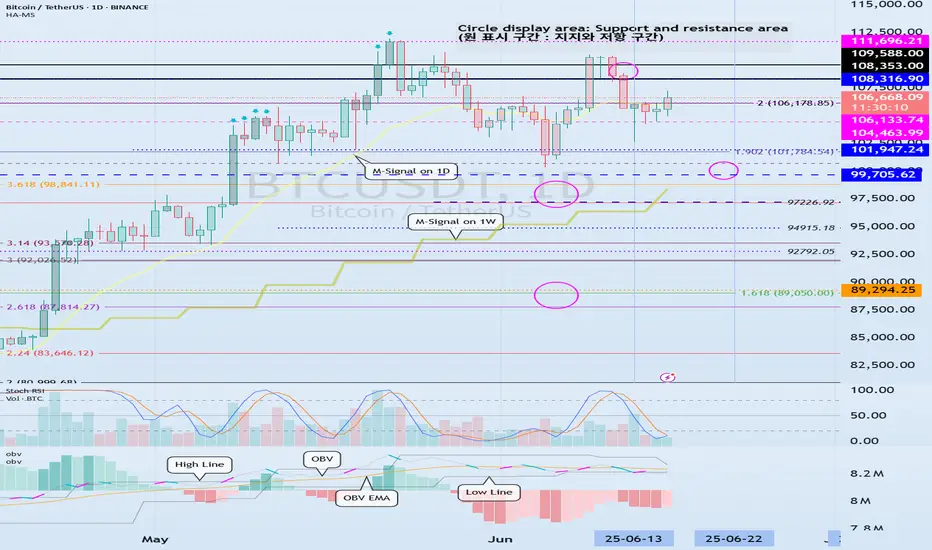
(BTCUSDT 1D chart)
The next volatility period we should pay attention to is around June 22nd (June 21-23).
Currently, the HA-High indicator of the 1D chart is formed at 108316.90, so the key is whether it can rise above that point and maintain the price.
If not, there is a possibility that it will touch the M-Signal indicator of the 1W chart.
In other words, we need to check whether there is support near 99705.62.
However, we need to check whether there is support near 104463.99-106133.74.
-
If we look at the auxiliary indicator OBV, the High Line is showing a downward trend.
This means that the high point is getting lower.
Therefore, if it rises above 108316.90 this time, we need to check whether the OBV can rise above the High Line and maintain it.
-
DOM(60), DOM(-60) indicators are displayed by the Close value.
HA-Low, HA-High indicators are displayed by the (Open + High + Low + Close) / 4 value.
Therefore, HA-Low and HA-High indicators represent the middle value, and DOM(60) and DOM(-60) represent the end point value.
This makes it difficult to trade when DOM(60) and DOM(-60) indicators are generated.
To make this clearer, I added an arrow signal.
DOM(60) indicator and HA-High indicator are indicators that represent high points.
In other words, the generation of DOM(60) indicator and HA-High indicator means that there has been a decline in the high point range.
However, as I mentioned earlier, the DOM(60) indicator is not easy to respond to because it indicates the end point, but the HA-High indicator indicates the middle value, so there is time to check whether there is support near the HA-High indicator and respond accordingly.
Therefore, you should check whether there is support in the section between the HA-High indicator and the DOM(60) indicator and respond accordingly.
On the contrary, the DOM(-60) indicator and the HA-Low indicator are indicators that indicate the low point.
You can think of it as the opposite of what I explained above.
-
By not indicating the support and resistance points according to the arrangement of the candles, but using the indicator points as the support and resistance points, anyone can see how the support and resistance points were created.
This will provide important objective information for trading.
-
Thank you for reading to the end.
I wish you successful trading.
--------------------------------------------------
- This is an explanation of the big picture.
(3-year bull market, 1-year bear market pattern)

I will explain more details when the bear market starts.
------------------------------------------------------
Other content (coins, stocks, etc.) is frequently posted on X.
X에 다른 내용(코인, 주식 등)이 자주 게시.
◆ t.me/readCryptoChannel
[HA-MS Indicator]
bit.ly/3YxHgvN
[OBV Indicator]
bit.ly/4dcyny3
X에 다른 내용(코인, 주식 등)이 자주 게시.
◆ t.me/readCryptoChannel
[HA-MS Indicator]
bit.ly/3YxHgvN
[OBV Indicator]
bit.ly/4dcyny3
Related publications
Disclaimer
The information and publications are not meant to be, and do not constitute, financial, investment, trading, or other types of advice or recommendations supplied or endorsed by TradingView. Read more in the Terms of Use.