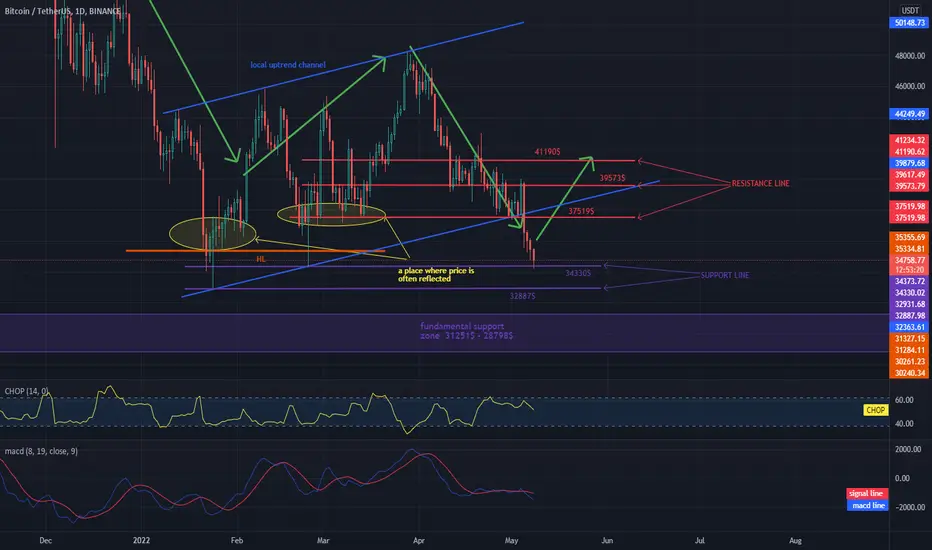
Hello everyone, let's take a look at the BTC to USDT chart on a 1 day time frame. As you can see, the price has dropped below the local uptrend channel.
Let's start with the designation of the support line and as you can see the first support in the near future is $ 34,330, if the support breaks, the next one is $ 32,887, then we have a fundamental support zone from $ 31,251 to $ 28,798.
Now let's move from the resistance line as you can see the first resistance is $ 37,519, if you can break it the next resistance will be $ 39,573 and $ 41,190.
Looking at the CHOP indicator, we can see that in the 1-day interval, despite the movement, there is still a lot of energy, while the MACD indicator shows a downward trend because the blue line crossed the red one from above and is below it.
Disclaimer
The information and publications are not meant to be, and do not constitute, financial, investment, trading, or other types of advice or recommendations supplied or endorsed by TradingView. Read more in the Terms of Use.
Disclaimer
The information and publications are not meant to be, and do not constitute, financial, investment, trading, or other types of advice or recommendations supplied or endorsed by TradingView. Read more in the Terms of Use.