Bitcoin traded between $105,971 and $106,032 over the past hour, with a market cap of $2.10 trillion and 24-hour volume of $21.88 billion. The price fluctuated between $104,004 and $106,450 over the past 24 hours, reflecting a narrow intraday range consistent with technical uncertainty on larger timeframes.
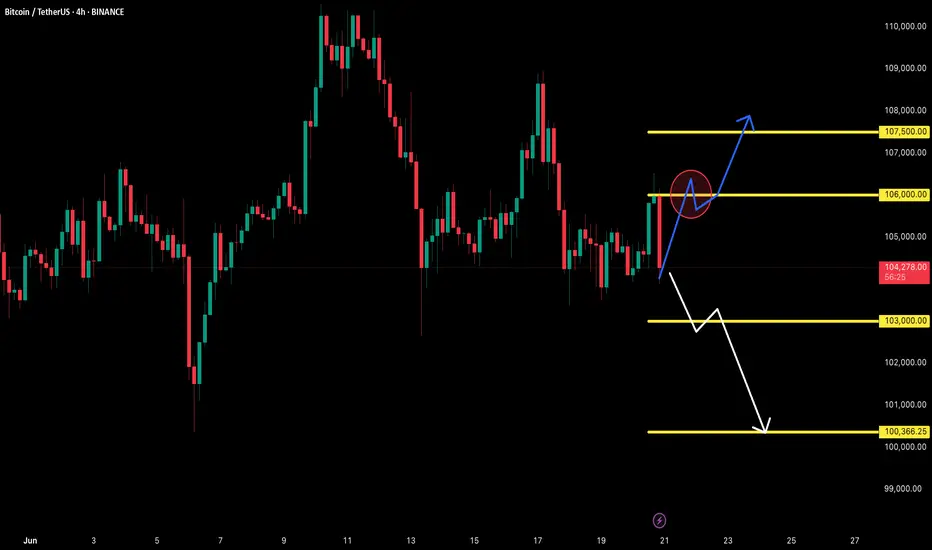
Analysis of the 4-hour Bitcoin chart shows a weak recovery phase from the recent drop to $103,388. The volume profile shows an ascending candlestick indicating increased interest, accumulation, and momentum. The rounding bottom structure shows a possible shift in short-term sentiment. Buying power is visible in the $105,500 to $106,000 region, especially when $106,500 is breached forcefully.
Bitcoin Price Watch: Bulls Target 108K as Momentum Grows on Lower Timeframes
BTC/USD daily chart on Bitstamp on June 20, 2025.
Technical indicators offer mixed signals. Among oscillators, the Relative Strength Index (RSI), Stochastics, Commodity Channel Index (CCI), Average Directional Index (ADX), and Ultra Oscillator are neutral. However, the Momentum Oscillator shows positive sentiment, while the Moving Average Convergence Divergence (MACD) shows negative reinforcement, highlighting the inherent contradiction in the directional trend. The moving averages (MAs) are generally biased bullish, with most short- to long-term indices and simple moving averages showing positive signals. Notably, only the 30-day simple moving average is contrary to this, with a negative reading.
In conclusion, while the intraday chart shows a constructive tone and provides opportunities for short-term positioning, the broader trend remains directionless with potential bearish risks. Unless Bitcoin reclaims the area above $110,000 with sustained volume, caution is advised. Traders would be wise to maintain tight risk control and focus on intraday momentum trading as the current daily pattern evolves.
Upside view:
If Bitcoin maintains momentum above $106,000 and breaks out of $106,521 convincingly, short-term traders can take advantage of a bullish setup with a target of $108,000 to $109,000. The alignment of buy signals from most moving averages further supports the potential for continued upside provided that the breakout is confirmed by volume and $107,500 is re-reached on a daily close. However, a failure to break out of $107,500 or a fresh sell-off around $106,450 could trigger a pullback to the $103,000 to $100,426 support zone, especially if the volume decreases at this point and the MACD confirms the bearish momentum.
𝐖𝐞𝐥𝐜𝐨𝐦𝐞 𝐓𝐨 𝐉𝐨𝐢𝐧 𝐆𝐨𝐥𝐝 𝐓𝐫𝐚𝐝𝐢𝐧𝐠 𝐂𝐥𝐮𝐛
t.me/+J_l6stZoLjY0Y2Nk
✅𝐃𝐚𝐢𝐥𝐲 𝟐-𝟒 𝐓𝐫𝐚𝐝𝐢𝐧𝐠 𝐒𝐢𝐠𝐧𝐚𝐥𝐬🔥
✅𝐇𝐢𝐠𝐡 𝐀𝐜𝐜𝐮𝐫𝐚𝐜𝐲 𝟗𝟓% 🔥
✅𝐖𝐞𝐞𝐤𝐥𝐲 𝐲𝐢𝐞𝐥𝐝 𝟗𝟎%-𝟗𝟓% 🔥
t.me/+J_l6stZoLjY0Y2Nk
t.me/+J_l6stZoLjY0Y2Nk
✅𝐃𝐚𝐢𝐥𝐲 𝟐-𝟒 𝐓𝐫𝐚𝐝𝐢𝐧𝐠 𝐒𝐢𝐠𝐧𝐚𝐥𝐬🔥
✅𝐇𝐢𝐠𝐡 𝐀𝐜𝐜𝐮𝐫𝐚𝐜𝐲 𝟗𝟓% 🔥
✅𝐖𝐞𝐞𝐤𝐥𝐲 𝐲𝐢𝐞𝐥𝐝 𝟗𝟎%-𝟗𝟓% 🔥
t.me/+J_l6stZoLjY0Y2Nk
Disclaimer
The information and publications are not meant to be, and do not constitute, financial, investment, trading, or other types of advice or recommendations supplied or endorsed by TradingView. Read more in the Terms of Use.