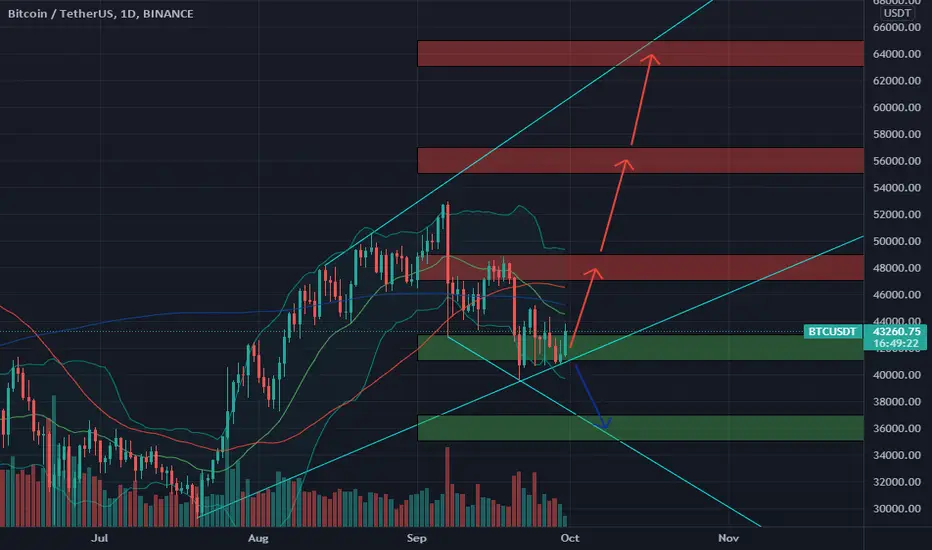
=BTC had stopped the decline at 42000$ several times and the buying force coming again so we could see a recovery and a rally so far in October. But if BTC loses the 42000$ zone again, it would be really a bad sign but this possibility is not high anymore
📈RED PLAN
♻️Condition : If 1-Day NOT closes ABOVE 42000$ zone
🔴Buy : 42000$
🔴Sell : 48000$ - 56000$ - 64000$
📉BLUE PLAN
♻️Condition : If 1-Day NOT closes ABOVE 42000$ zone
🔵Sell : 42000$
🔵Buy : 36000$
❓Details
🚫Stoploss for Long : 10%
🚫Stoploss for Short : 5%
📈Red Arrow : Main Direction as RED PLAN
📉Blue Arrow : Back-Up Direction as BLUE PLAN
🟩Green zone : Support zone as BUY section
🟥Red zone : Resistance zone as SELL section
🅰️A : The Close price of 1-day candlestick is Above the zone
🅱️B : The Close price of 1-day candlestick is Below the zone
Disclaimer
The information and publications are not meant to be, and do not constitute, financial, investment, trading, or other types of advice or recommendations supplied or endorsed by TradingView. Read more in the Terms of Use.
Disclaimer
The information and publications are not meant to be, and do not constitute, financial, investment, trading, or other types of advice or recommendations supplied or endorsed by TradingView. Read more in the Terms of Use.