Hello Guys!
Let's analyze btc!
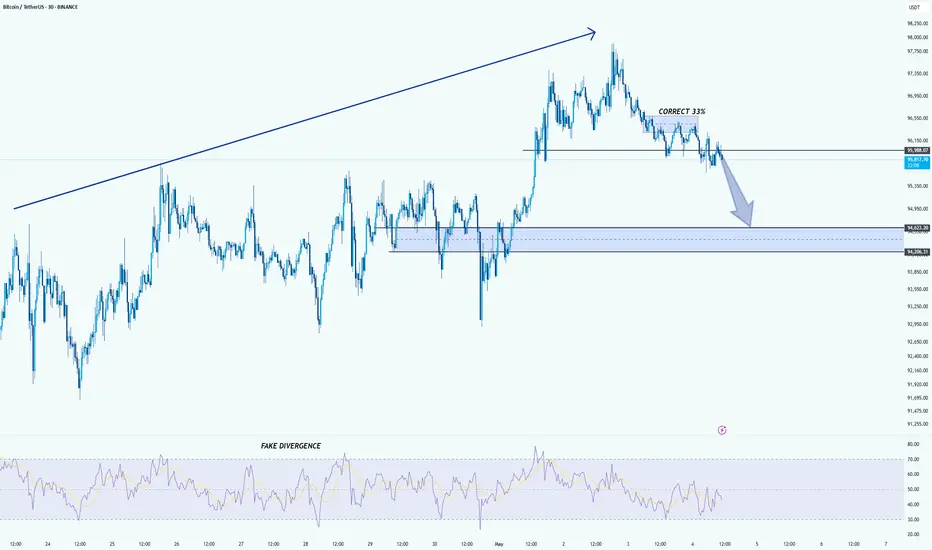
Rising Trendline Break: The bullish structure has broken down as the price failed to hold above the key support region around $96,000–$96,200.
Targeted Demand Zone: The highlighted purple box between $94,200 and $94,700 represents a demand zone that has previously shown strong buyer interest. The current structure suggests Bitcoin may revisit this zone for a potential bounce.
Bearish Momentum: A large arrow indicates the directional bias toward the downside, aligning with the correction and market sentiment.
Fake RSI Divergence: The RSI panel indicates a “Fake Divergence” pattern, which may have misled early bulls. RSI has since dropped and currently hovers in the neutral zone, with no strong bullish signals yet.
_____________________________
Conclusion:
Unless a strong bounce occurs around current levels, Bitcoin looks poised to correct further toward the $94,200–$94,700 demand zone. Traders should watch for reactionary price action and bullish reversal patterns before considering long entries.
Let's analyze btc!
Rising Trendline Break: The bullish structure has broken down as the price failed to hold above the key support region around $96,000–$96,200.
Targeted Demand Zone: The highlighted purple box between $94,200 and $94,700 represents a demand zone that has previously shown strong buyer interest. The current structure suggests Bitcoin may revisit this zone for a potential bounce.
Bearish Momentum: A large arrow indicates the directional bias toward the downside, aligning with the correction and market sentiment.
Fake RSI Divergence: The RSI panel indicates a “Fake Divergence” pattern, which may have misled early bulls. RSI has since dropped and currently hovers in the neutral zone, with no strong bullish signals yet.
_____________________________
Conclusion:
Unless a strong bounce occurs around current levels, Bitcoin looks poised to correct further toward the $94,200–$94,700 demand zone. Traders should watch for reactionary price action and bullish reversal patterns before considering long entries.
Trade active
close half ot it here!
Trade closed: target reached
the final target is touched
Proud ThinkMarkets Ambassador -> Discover & Grow: bit.ly/Think-Markets
------
My recommended Exchange -> YEX: bit.ly/YEX-M
------
Telegram channel: t.me/melikatrader94
Forex channel: t.me/melikatrader94GoldForex
------
My recommended Exchange -> YEX: bit.ly/YEX-M
------
Telegram channel: t.me/melikatrader94
Forex channel: t.me/melikatrader94GoldForex
Related publications
Disclaimer
The information and publications are not meant to be, and do not constitute, financial, investment, trading, or other types of advice or recommendations supplied or endorsed by TradingView. Read more in the Terms of Use.