🔮 #BTC Analysis 💰💰
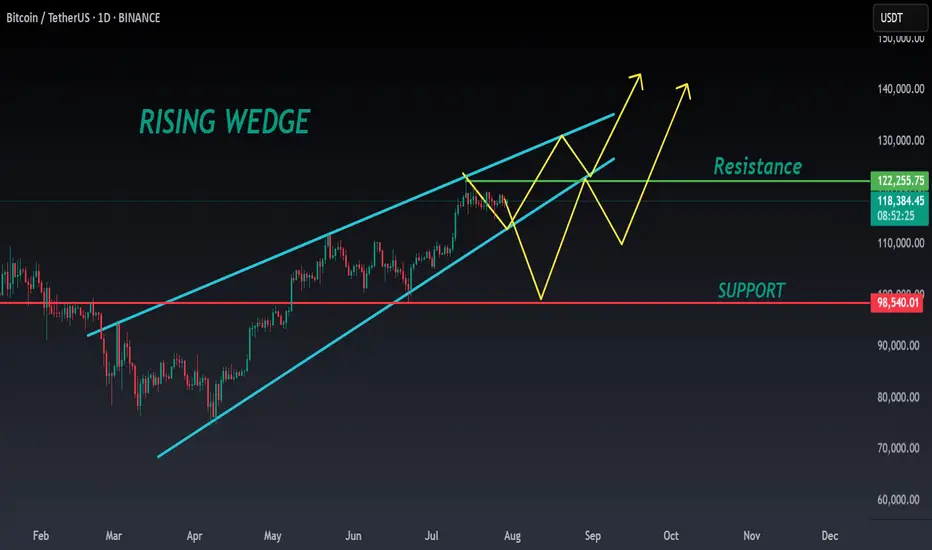
🌟🚀As we said #BTC performed same. Now, In daily chart we can see a formation "Rising Wedge Pattern in #BTC. There is a strong resistance zone and we could see a rejection from that level but if the price breaks the resistance zone then we would see a bullish move 💲💲
🔖 Current Price: $1,18,590
⁉️ What to do?
- We have marked some crucial levels in the chart. We can trade according to the chart and make some profits in #BTC. 🚀💸
#BTC #Cryptocurrency #DYOR #PotentialBreakout
Become profitable trader!
Try our channels for Crypto Signals, Alerts and Secret Indicators
linktr.ee/zeus_market_alerts
Join our FREE Channel On Telegram linktr.ee/zeus_market_alerts
Try our channels for Crypto Signals, Alerts and Secret Indicators
linktr.ee/zeus_market_alerts
Join our FREE Channel On Telegram linktr.ee/zeus_market_alerts
Related publications
Disclaimer
The information and publications are not meant to be, and do not constitute, financial, investment, trading, or other types of advice or recommendations supplied or endorsed by TradingView. Read more in the Terms of Use.