How to Use the PCCE + False Breakout Detector to Catch Trap Zones in BTC
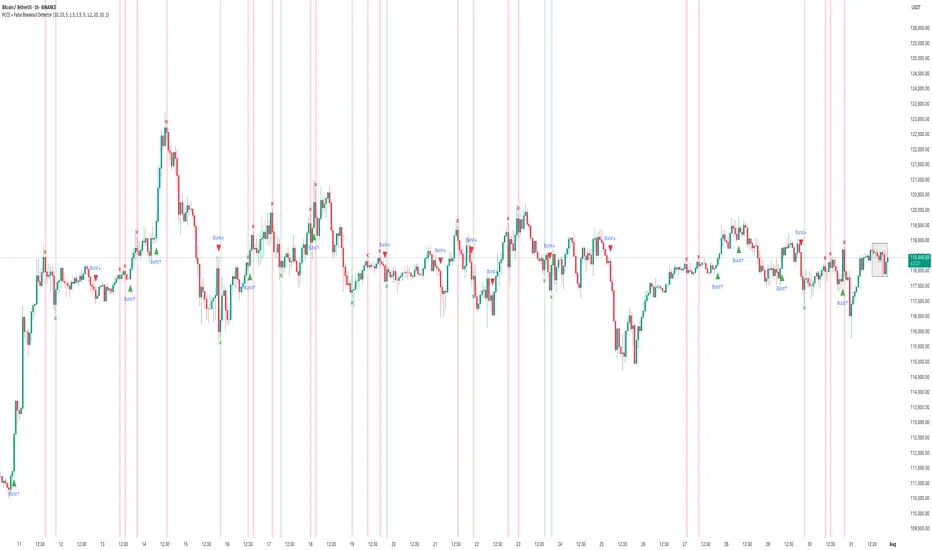
Chart: BTC/USDT (1H)
Tool Used: PCCE + False Breakout Detector
Type: Educational – How to identify false breakouts and anticipate trend shifts.
⸻
🧠 What the Indicator Does:
The PCCE + False Breakout Detector is designed to identify breakouts from coiling ranges and filter out trap moves that often fool traders.
🔹 Burst↑ / Burst↓: Valid breakout from a price coil with volume and trend alignment
🔻 Red X: Marks a bull trap — breakout failed and price reversed lower
🟢 Green X: Marks a bear trap — breakdown failed and price reversed higher
By flagging where breakout structure fails, the indicator helps traders avoid false entries and position early for reversals.
⸻
✅ Recent Performance Highlights (BTCUSDT 1H):
📈 From July 13–31:
• Burst↑ on July 13 led to a clean uptrend (+$1,500 gain)
• Red X on July 16 called a failed breakout — price dropped hard
• Green X on July 16 caught the bear trap — price reversed immediately
• Burst↓ on July 21 triggered a sharp decline, validating breakdown
• Red X on July 30 spotted the bull trap just before price reversed down
📉 Even in sideways ranges, Red/Green Xs signaled when the move lacked conviction, allowing traders to wait instead of chasing noise.
⸻
🔍 Current Interpretation:
• BTC is trading inside a choppy structure after a recent Burst↑ and Red X combo.
• The X mark zone (gray box) warns of instability — bulls attempted a breakout but failed.
• If price continues to stay below the Red X high → likely retracement ahead.
• If we see a Green X + rally soon → potential reversal setup in progress.
⸻
📚 How-To Use the Indicator:
1. Burst Signals (Breakouts)
🔸 Use these to enter when coil compression breaks with volume
🔸 Works best when aligned with EMA trend and breakout body
2. Red / Green X (False Breakout Detector)
❌ Red X: Price spiked above resistance but lacked follow-through → trap
✅ Green X: Price dipped below support but got bought → trap
3. Confirm with Price Context
🔄 Look for reaction candles after X marks
📏 Set tighter stops — traps often reverse fast
🔔 Combine with your S/R zones or order block theory
⸻
🧠 Final Thoughts:
The PCCE + False Breakout Detector isn’t just about spotting momentum — it’s about reading intent vs. failure in price action.
BTC’s current structure shows signs of indecision. Trust the Xs to tell you whether the move has legs — or is just another trap.
🎯 Learn to trade the trap, not fall into it.
Thanks.
TradeTech Analysis
Telegram Channel - t.me/Tradetech2024
Youtube Channel - youtube.com/@TradeTechAnalysis
Website - tradetechanalysis.com/
TradeTech Analysis
Telegram Channel - t.me/Tradetech2024
Youtube Channel - youtube.com/@TradeTechAnalysis
Website - tradetechanalysis.com/
Disclaimer
The information and publications are not meant to be, and do not constitute, financial, investment, trading, or other types of advice or recommendations supplied or endorsed by TradingView. Read more in the Terms of Use.