💀 Hey , how's it going ? Come over here — Satoshi got something for you !
⏰ We’re analyzing BTC on the 1-hour timeframe .
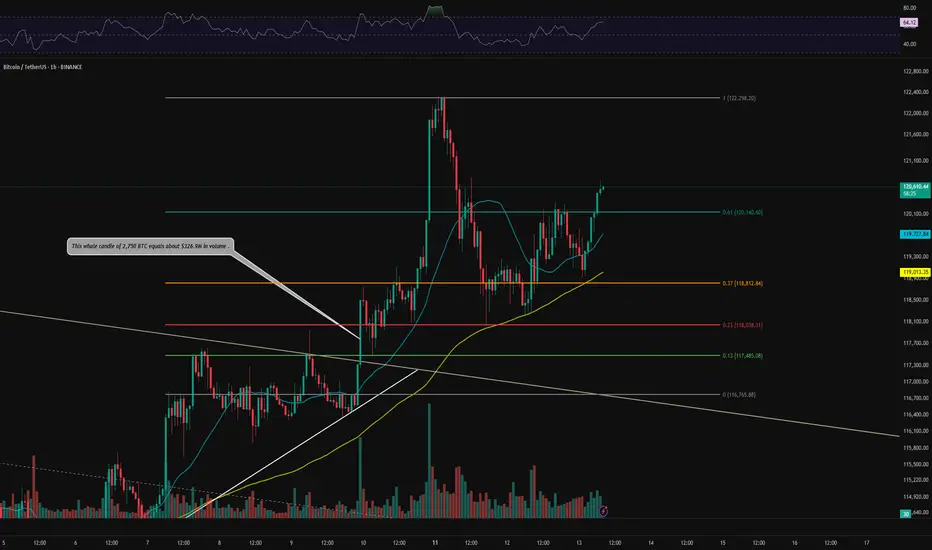
👀 After completing its correction, BTC broke the 120,140 zone and consolidated above it, now heading toward higher resistance levels. Increasing buy volume and support from moving averages are observed .
🎮 Fib drawn from the bearish channel breakout to the 122,300 ticker seller zone. The last resistance for ending the correction and forming a new bullish structure was the 0.61 Fib level, which was broken and consolidated above. The next resistance (potential new ATH) is at the 0 Fib level .
⚙️ BTC is approaching the overbought zone on RSI , which could facilitate a stronger push toward resistance and a potential breakout .
👑 Moving Averages:
MAs (medium and low wave cycles) are strongly bullish , showing high momentum .
🕯 Volume & Market Session :
Rising buy volume is noted . We're approaching the New York session, which may bring increased buying pressure. Stay at your system during this session to monitor the chart .
🔔 Set an alert at 122,300 to observe price behavior. This zone offers low-risk trading opportunities , and price action here can guide trade decisions .
🖥 Summary : BTC has broken the key Fibonacci zone, signaling the end of its correction. Taking a long position now may be challenging , but price action at 122,300 can provide a good trading opportunity .
📊 On the 1H timeframe for USDT.D , USDT.D broke the 4.10 zone and is moving downward. The next support is at 3.92 .
❤️ Disclaimer : This analysis is purely based on my personal opinion and I only trade if the stated triggers are activated .
⏰ We’re analyzing BTC on the 1-hour timeframe .
👀 After completing its correction, BTC broke the 120,140 zone and consolidated above it, now heading toward higher resistance levels. Increasing buy volume and support from moving averages are observed .
🎮 Fib drawn from the bearish channel breakout to the 122,300 ticker seller zone. The last resistance for ending the correction and forming a new bullish structure was the 0.61 Fib level, which was broken and consolidated above. The next resistance (potential new ATH) is at the 0 Fib level .
⚙️ BTC is approaching the overbought zone on RSI , which could facilitate a stronger push toward resistance and a potential breakout .
👑 Moving Averages:
MAs (medium and low wave cycles) are strongly bullish , showing high momentum .
🕯 Volume & Market Session :
Rising buy volume is noted . We're approaching the New York session, which may bring increased buying pressure. Stay at your system during this session to monitor the chart .
🔔 Set an alert at 122,300 to observe price behavior. This zone offers low-risk trading opportunities , and price action here can guide trade decisions .
🖥 Summary : BTC has broken the key Fibonacci zone, signaling the end of its correction. Taking a long position now may be challenging , but price action at 122,300 can provide a good trading opportunity .
📊 On the 1H timeframe for USDT.D , USDT.D broke the 4.10 zone and is moving downward. The next support is at 3.92 .
❤️ Disclaimer : This analysis is purely based on my personal opinion and I only trade if the stated triggers are activated .
join our Telegram channel for more insightful and educational content .
t.me/satoshiframetr
t.me/satoshiframetr
Related publications
Disclaimer
The information and publications are not meant to be, and do not constitute, financial, investment, trading, or other types of advice or recommendations supplied or endorsed by TradingView. Read more in the Terms of Use.