Hello, traders!
Follow us for quick updates.
Have a great day!
-------------------------------------
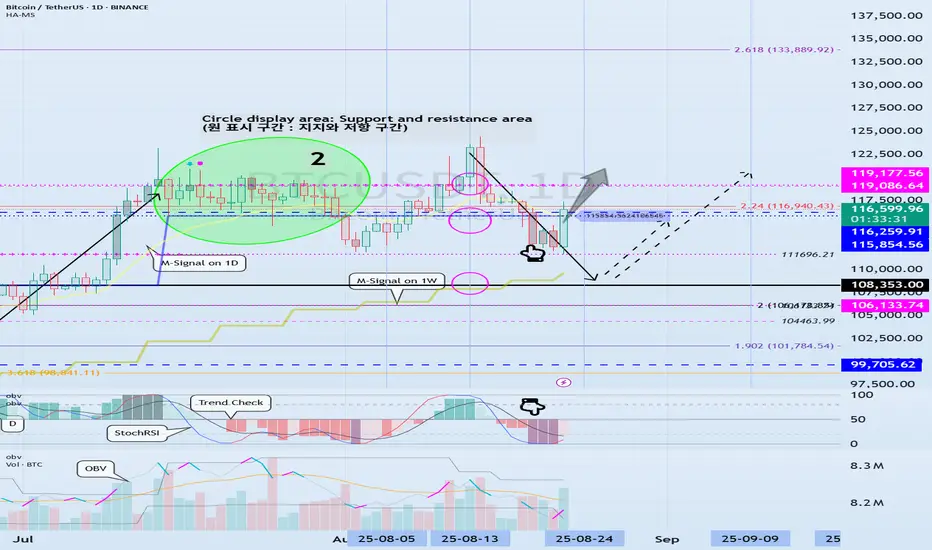
(BTCUSDT 1D chart)
This period of volatility is expected to last from August 23rd to 25th.
It found support near 111696.21 and rose above 115854.56.
Therefore, the key question is whether it can find support near 115854.56 and rise above 119177.56.
If it falls below 115854.56, it could fall to around 108353.0.
If it rises above 119177.56 this time and holds, it could attempt to rise near the right Fibonacci level 2.618 (133889.92) during the next volatility period, around September.
Therefore, we should watch for support in the HA-High ~ DOM (60) range of 115854.56-119177.56 and see if it rises above that level.
-
Looking at the OBV indicator of the Low Line ~ High Line channel, it appears to be transitioning into a downward channel.
Therefore, if the OBV indicator fails to rise above the High Line, there is a possibility of forming a short-term top.
-
Thank you for reading to the end.
I wish you successful trading.
--------------------------------------------------
- Here's an explanation of the big picture.
(3-year bull market, 1-year bear market pattern)

I will explain more in detail when the bear market begins.
------------------------------------------------------
Trade active
#BTCUSDTThe M-Signal indicator on the 1W chart appears likely to form at the 116259.91 level.
Therefore, I believe the 115854.56-119177.56 range is likely to act as resistance.
Buying is needed to break above the 115854.56-119177.56 range.
Therefore, we need to monitor whether the TC (Trend Check) indicator rises above 0 and maintains the upward trend.
This period of volatility is expected to last until August 25th.
The next period of volatility is expected around September 9th.
At this point, you should watch for a rise above 115854.56-119177.56 or a decline below 104463.99-106133.74.
If the price falls below the M-Signal indicator on the 1W chart and remains there, a downtrend is likely, so you should consider a response plan.
If this happens, the price is likely to decline until it meets the M-Signal indicator on the 1M chart.
Note
#BTCUSDTThe key is whether it can find support near 108353.0 and rise.
If it fails to do so and falls, it could decline until it meets the M-Signal indicator on the 1M chart.
At this point, the key is whether it can find support near the Fibonacci level of 1.618 (89050.0).
Looking more closely, there are three key areas for continuing the uptrend. 1st: 116259.91-119086.64
2nd: 10446.99-108353.0
3rd: Left Fibonacci ratio 2.618 (87814.27) ~ Left Fibonacci ratio 3.14 (93570.28)
The first level is a level that must break above to continue the step-like uptrend,
and the second level requires support to maintain the uptrend.
A decline below the third level indicates a potential medium- to long-term downtrend.
Therefore, the key question is whether the price can find support near the second level (10446.99-108353.0) and rise.
The next period of volatility is around September 9th.
To continue the third-stage uptrend, the price must rise above the 115854.56-119177.56 range and hold.
Note
#BTCUSDTIt's rising after touching the 108353.0 level, near the M-Signal indicator on the 1W chart.
Therefore, the key question is whether it can find support near 111696.21 and continue its upward trend.
During an upward trend, it's crucial to break above the 115,854.56-116,259.91 range and maintain the price.
If not, there's a high chance of a downward reversal.
The three boxed areas shown on the chart represent important areas, so it's important to closely monitor any movement within these areas.
Note
#BTCUSDTSelling pressure appears to be increasing as the price falls below the previous high trendline (1).
However, it's important to check for support around 10463.99-108.353.0.
It's also important to watch for support along the rising channel (2).
If it rises along the rising channel, a significant trend shift is likely around the week of January 26, 2026.
If it falls below the M-Signal indicator on the 1M chart, a medium- to long-term downtrend is likely.
At this point, the key area is support around the left Fibonacci level of 2.618 (87814.27) to the left Fibonacci level of 3.14 (93570.28).
If it rises above 119086.64, it is expected to rise toward the right Fibonacci level of 2.618 (133889.92).
The circle (3) represents two long-term uptrend lines, which are likely to act as resistance, so we should consider countermeasures.
As mentioned in the previous SOL chart, a major bear market is likely to begin in the first quarter of 2026.
Note
#BTCUSDTBased on section 2, we need to examine whether the price will rise above section 1 or fall to section 3.
This period of volatility is expected to last until September 7th.
The next period of volatility is expected to occur around the week of November 24th.
The basic trading strategy is to buy in the DOM(-60) ~ HA-Low range and sell in the HA-High ~ DOM(60) range.
However, if the price rises in the HA-High ~ DOM(60) range, a step-up trend is likely, while if the price falls in the DOM(-60) ~ HA-Low range, a step-down trend is likely.
Therefore, a split trading strategy is recommended.
Currently, the price is falling within the HA-High ~ DOM(60) range, i.e., the 116259.91-119086.64 range.
If the price falls within the HA-High ~ DOM(60) range, it is likely to continue falling until it meets the DOM(-60) or HA-Low indicator.
Therefore, we need to consider countermeasures for this.
If the price falls below the M-Signal indicator on the 1W chart, it is likely to continue falling until it meets the M-Signal indicator on the 1M chart.
At this point, the key is whether support can be found around the 3rd zone.
Therefore, summarizing the above, we can see that the 2nd zone plays a key role in determining the trend.
A downtrend is likely to begin when the price falls below the M-Signal indicator on the 1M chart, so we need to consider countermeasures for this as well.
According to wave theory, the fifth wave appears to be ending and a downtrend is about to begin.
However, judging by the rising HA-High indicator, two step-up movements have occurred, and this rise will mark the third step-up movement.
Therefore, if a new HA-High or HA-Low indicator is formed, support at that level is crucial.
Currently, the HA-Low indicator is formed at 17,880.71, so if the price declines, the HA-Low indicator is likely to form.
If the HA-Low indicator forms, the current step-up movement will be reset, and the trend will re-establish based on the HA-Low indicator.
-
The basic trading strategy explains everything.
That's why I'm explaining important points and periods.
If you don't understand this, you should read the ideas I publish regularly.
Then you'll understand why.
Note
#BTCUSDTWith this decline, the HA-High indicator is showing signs of forming at 99698.31.
Therefore, we should check to see if the HA-HIgh indicator forms at 99698.31 when the new month begins.
Furthermore, the DOM(60) indicator is showing signs of forming at 108246.35, so we should also check for support at this level.
In other words, the 99698.31-108246.35 range corresponds to the HA-HIgh ~ DOM(60) range, so we should consider a response plan.
The basic trading strategy is to buy between DOM(-60) and HA-Low and sell between HA-High and DOM(60).
However, if the price rises from the HA-High to DOM(60) range, it is likely to exhibit a step-like upward trend. If the price falls from the DOM(-60) to HA-Low range, it is likely to exhibit a step-like downward trend.
Therefore, the basic trading strategy should be a segmented trading approach.
-
The above interpretation suggests that as long as the HA-High indicator shows signs of forming, there is a high probability of a decline to the level where the HA-High indicator is forming.
Therefore, this reaffirms the importance of support in the second range.
※ Follow X to check out the posts.
※ X를 팔로우하고 게시물을 확인하세요.
◆ t.me/readCryptoChannel
[HA-MS Indicator]
bit.ly/3YxHgvN
[OBV Indicator]
bit.ly/4dcyny3
※ X를 팔로우하고 게시물을 확인하세요.
◆ t.me/readCryptoChannel
[HA-MS Indicator]
bit.ly/3YxHgvN
[OBV Indicator]
bit.ly/4dcyny3
Related publications
Disclaimer
The information and publications are not meant to be, and do not constitute, financial, investment, trading, or other types of advice or recommendations supplied or endorsed by TradingView. Read more in the Terms of Use.