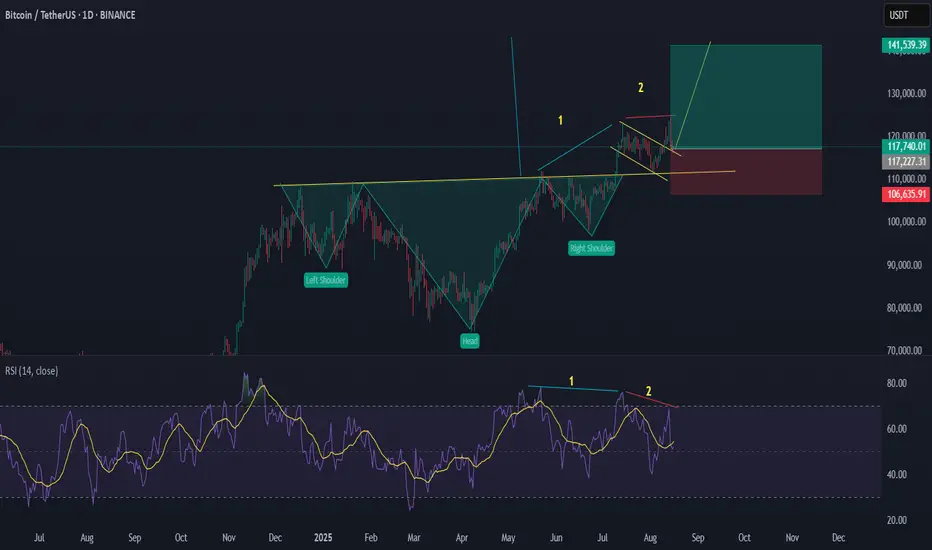
BTC has broken out from a long-term Inverse Head & Shoulders pattern, and despite short-term weakness (RSI divergence), the macro structure remains bullish.
🔍 Supporting Signs:
Breakout above neckline held as support (so far).
The wedge could be a bull flag, not a topping pattern.
Pullback may be a retest before resuming upward momentum.
Target (from H & S) projects price toward $140K–$145K.
🔼 Bullish Targets:
Short-term: $125K
Mid-term: $135K
Full target: $142K–$145K
Disclaimer
The information and publications are not meant to be, and do not constitute, financial, investment, trading, or other types of advice or recommendations supplied or endorsed by TradingView. Read more in the Terms of Use.
Disclaimer
The information and publications are not meant to be, and do not constitute, financial, investment, trading, or other types of advice or recommendations supplied or endorsed by TradingView. Read more in the Terms of Use.