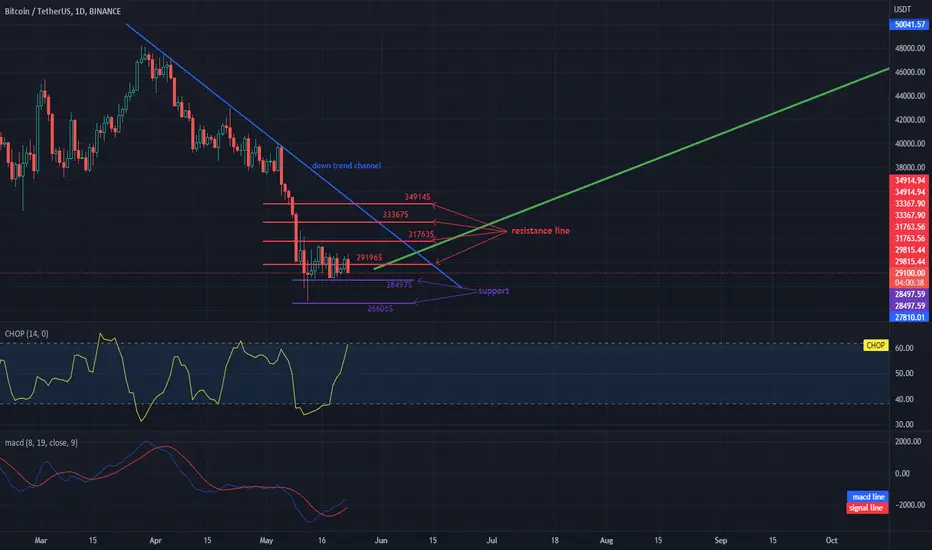
Hello everyone, let's take a look at the BTC to USDT chart over the 1 day timeframe. As you can see, the price is moving below the downtrend line.
Let's start with the designation of the support line and as you can see the first support in the near future is $ 28,497, if the support breaks down, the next one is $ 26,606.
Now let's move from the resistance line as you can see the first resistance is $ 29,196, if you can break it the next resistance will be $ 31,763, $ 33,367 and $ 34,914.
Looking at the CHOP indicator, we can see that nha in the 1-day range has a lot of energy that we can use in the near future, although the MACD indicator indicates that we should enter an uptrend.
Be especially careful and use stop loss when trading.
Disclaimer
The information and publications are not meant to be, and do not constitute, financial, investment, trading, or other types of advice or recommendations supplied or endorsed by TradingView. Read more in the Terms of Use.
Disclaimer
The information and publications are not meant to be, and do not constitute, financial, investment, trading, or other types of advice or recommendations supplied or endorsed by TradingView. Read more in the Terms of Use.