Bitcoin’s price has been having difficulty approaching its all-time high of $75K and is still consolidating.
On Friday, the cryptocurrency tanked below $70K, and if the current level supporting the price breaks down, an even deeper correction could be expected.
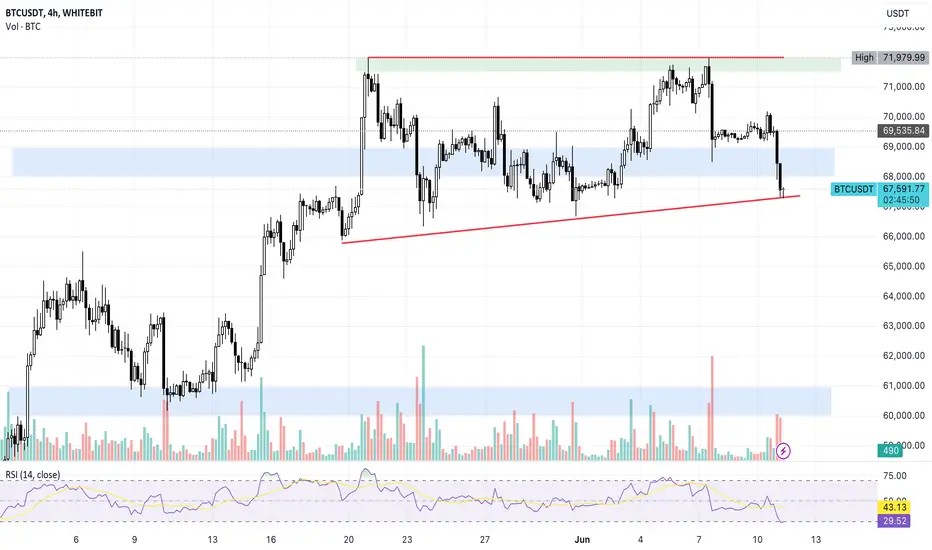
Looking at the 4-hour chart, things seem tricky for Bitcoin. An ascending channel is currently being formed around the $70K mark. The price has already tested the pattern’s higher trendline and the $72K resistance level twice. It was rejected decisively and is testing the $SWB:69K support level once again.
A breakdown of this level could cause even more trouble. If the pattern is broken to the downside, a deeper drop toward the $60K would likely materialize in the short term.
With the RSI also below 50%, the bearish scenario seems probable.

 BTCUSDT
On Friday, the cryptocurrency tanked below $70K, and if the current level supporting the price breaks down, an even deeper correction could be expected.
Looking at the 4-hour chart, things seem tricky for Bitcoin. An ascending channel is currently being formed around the $70K mark. The price has already tested the pattern’s higher trendline and the $72K resistance level twice. It was rejected decisively and is testing the $SWB:69K support level once again.
A breakdown of this level could cause even more trouble. If the pattern is broken to the downside, a deeper drop toward the $60K would likely materialize in the short term.
With the RSI also below 50%, the bearish scenario seems probable.
Disclaimer
The information and publications are not meant to be, and do not constitute, financial, investment, trading, or other types of advice or recommendations supplied or endorsed by TradingView. Read more in the Terms of Use.
Disclaimer
The information and publications are not meant to be, and do not constitute, financial, investment, trading, or other types of advice or recommendations supplied or endorsed by TradingView. Read more in the Terms of Use.