📊 Market Breakdown
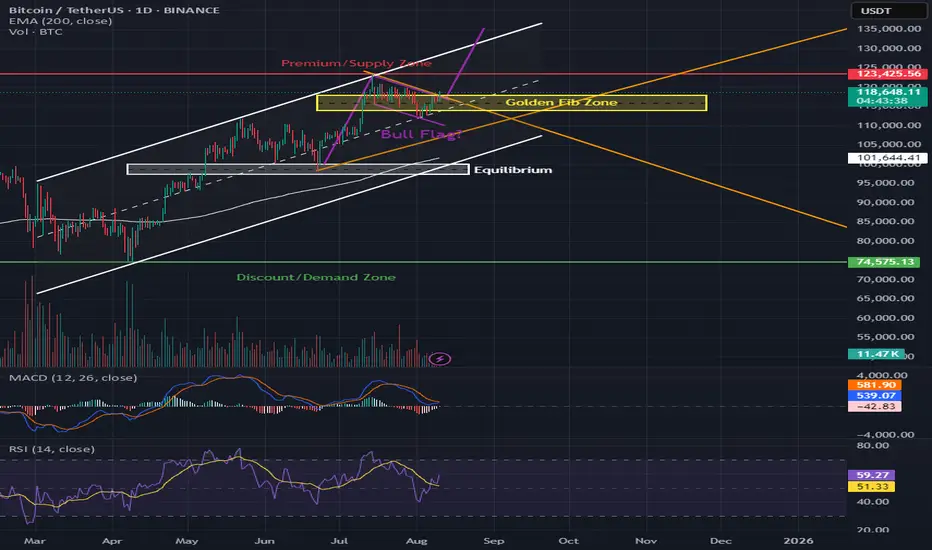
BTC is trading at $118,603, consolidating in a bull flag pattern right inside the Golden Fib Zone (~$116K–$119K). The 200 EMA at $101,643 remains well below, showing this is still a bullish mid-term trend. If we break out, $123K (Premium/Supply Zone) is next — but if the flag fails, we could revisit equilibrium.
Trend: Higher highs and higher lows since the April 2025 bottom; now flagging under major resistance.
Key Structure: Golden Fib Zone acting as a launchpad; $116K equilibrium below as near-term support.
Volume: Consolidation volume dropping — typical for a flag before breakout.
Indicators:
MACD: Bearish crossover still present but flattening — momentum could flip.
RSI: 59.16 – mid-zone, leaving room for an upside push.
🛒 LONGS (Bullish Scenario)
Buy Zones:
🎯 Aggressive Entry: $116K–$117K bounce within flag
✅ Confirmation Entry: Daily close above $119.5K
Take Profits:
1️⃣ $123K – Premium/Supply Zone
2️⃣ $128K – Upper channel resistance
3️⃣ $135K – Extension target if breakout is strong
Stop-Loss: $114.5K
Why This Works: Bull flag breakouts often lead to sharp continuation moves; $123K is the first magnet above.
🛑 SHORTS (Bearish Scenario)
Sell Zones:
🚨 Aggressive Entry: Rejection at $119.5K
📉 Breakdown Entry: Close below $116K
Take Profits:
1️⃣ $112K – Mid-channel support
2️⃣ $107K – Pre-breakout base
3️⃣ $101.6K – 200 EMA & strong demand
Stop-Loss: $121K
Why This Works: Losing $116K invalidates the bull flag and opens the door for a retest of the lower supports.
🔍 Technical Highlights
Bull Flag in Play: Textbook consolidation before a possible leg higher.
Golden Fib Zone: Price coiling in a key retracement area before breakout/rollover.
Macro Watch: BTC’s next move will heavily influence crypto-related stocks (MSTR, RIOT, MARA).
Disclaimer
The information and publications are not meant to be, and do not constitute, financial, investment, trading, or other types of advice or recommendations supplied or endorsed by TradingView. Read more in the Terms of Use.
Disclaimer
The information and publications are not meant to be, and do not constitute, financial, investment, trading, or other types of advice or recommendations supplied or endorsed by TradingView. Read more in the Terms of Use.