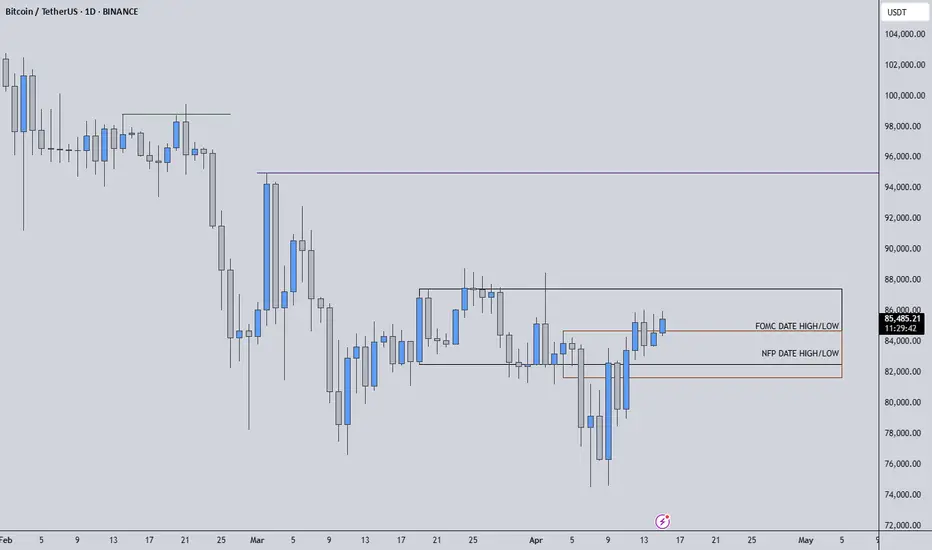
This current structure on Bitcoin is giving us a beautiful narrative rooted in macro timing: we've regained the NFP day levels, and now we’re trading right inside the highs and lows of the FOMC date—a zone that historically acts as a decision-making pivot for the market.
📍 Why These Levels Matter:
NFP and FOMC sessions are not just about volatility—they often define institutional positioning and sentiment shifts.
We’ve already regained NFP day's range, showing bullish resilience and strength.
Now all eyes are on the FOMC range: if we manage to break and retest the high of the FOMC candle, it can ignite momentum toward the monthly target.
🧠 How I’m Thinking About It:
I’m not jumping the gun. I’ll wait for lower time frame confirmations, ideally some clean breaks with supportive delta and CDV structure.
If we fail to hold these levels and fall back inside, I won’t insist on any long idea. I’ll flip short the moment downside momentum is confirmed.
💬 Final Thought: We don't randomly mark levels. These are deliberately chosen based on price behavior during major economic events—something most traders overlook. That’s what gives us the edge. If you're following me, you're not trading noise. You're learning to understand the story behind price action.
Watch these levels closely. They may be the starting point of something much bigger.
📌I keep my charts clean and simple because I believe clarity leads to better decisions.
📌My approach is built on years of experience and a solid track record. I don’t claim to know it all but I’m confident in my ability to spot high-probability setups.
📌If you would like to learn how to use the heatmap, cumulative volume delta and volume footprint techniques that I use below to determine very accurate demand regions, you can send me a private message. I help anyone who wants it completely free of charge.
🔑I have a long list of my proven technique below:
I stopped adding to the list because it's kinda tiring to add 5-10 charts in every move but you can check my profile and see that it goes on..
📍 Why These Levels Matter:
NFP and FOMC sessions are not just about volatility—they often define institutional positioning and sentiment shifts.
We’ve already regained NFP day's range, showing bullish resilience and strength.
Now all eyes are on the FOMC range: if we manage to break and retest the high of the FOMC candle, it can ignite momentum toward the monthly target.
🧠 How I’m Thinking About It:
I’m not jumping the gun. I’ll wait for lower time frame confirmations, ideally some clean breaks with supportive delta and CDV structure.
If we fail to hold these levels and fall back inside, I won’t insist on any long idea. I’ll flip short the moment downside momentum is confirmed.
💬 Final Thought: We don't randomly mark levels. These are deliberately chosen based on price behavior during major economic events—something most traders overlook. That’s what gives us the edge. If you're following me, you're not trading noise. You're learning to understand the story behind price action.
Watch these levels closely. They may be the starting point of something much bigger.
📌I keep my charts clean and simple because I believe clarity leads to better decisions.
📌My approach is built on years of experience and a solid track record. I don’t claim to know it all but I’m confident in my ability to spot high-probability setups.
📌If you would like to learn how to use the heatmap, cumulative volume delta and volume footprint techniques that I use below to determine very accurate demand regions, you can send me a private message. I help anyone who wants it completely free of charge.
🔑I have a long list of my proven technique below:
- 🎯 ZENUSDT.P: Patience & Profitability | %230 Reaction from the Sniper Entry
- 🐶 DOGEUSDT.P: Next Move
- 🎨 RENDERUSDT.P: Opportunity of the Month
- 💎 ETHUSDT.P: Where to Retrace
- 🟢 BNBUSDT.P: Potential Surge
- 📊 BTC Dominance: Reaction Zone
- 🌊 WAVESUSDT.P: Demand Zone Potential
- 🟣 UNIUSDT.P: Long-Term Trade
- 🔵 XRPUSDT.P: Entry Zones
- 🔗 LINKUSDT.P: Follow The River
- 📈 BTCUSDT.P: Two Key Demand Zones
- 🟩 POLUSDT: Bullish Momentum
- 🌟 PENDLEUSDT.P: Where Opportunity Meets Precision
- 🔥 BTCUSDT.P: Liquidation of Highly Leveraged Longs
- 🌊 SOLUSDT.P: SOL's Dip - Your Opportunity
- 🐸 1000PEPEUSDT.P: Prime Bounce Zone Unlocked
- 🚀 ETHUSDT.P: Set to Explode - Don't Miss This Game Changer
- 🤖 IQUSDT: Smart Plan
- ⚡️ PONDUSDT: A Trade Not Taken Is Better Than a Losing One
- 💼 STMXUSDT: 2 Buying Areas
- 🐢 TURBOUSDT: Buy Zones and Buyer Presence
- 🌍 ICPUSDT.P: Massive Upside Potential | Check the Trade Update For Seeing Results
- 🟠 IDEXUSDT: Spot Buy Area | %26 Profit if You Trade with MSB
- 📌 USUALUSDT: Buyers Are Active + %70 Profit in Total
- 🌟 FORTHUSDT: Sniper Entry +%26 Reaction
- 🐳 QKCUSDT: Sniper Entry +%57 Reaction
- 📊 BTC.D: Retest of Key Area Highly Likely
- 📊 XNOUSDT %80 Reaction with a Simple Blue Box!
- 📊 BELUSDT Amazing %120 Reaction!
I stopped adding to the list because it's kinda tiring to add 5-10 charts in every move but you can check my profile and see that it goes on..
Professional Day Trader
Microstructure Practicioner
t.me/umuttrades
kick.com/umuttrades live everyday.
Microstructure Practicioner
t.me/umuttrades
kick.com/umuttrades live everyday.
Related publications
Disclaimer
The information and publications are not meant to be, and do not constitute, financial, investment, trading, or other types of advice or recommendations supplied or endorsed by TradingView. Read more in the Terms of Use.