Since bottoming on November 21, 2022, Bitcoin has embarked on a remarkable bull run, rising +623.5% over 927 days and reaching a new all-time high (ATH) of ~112K.
When compared to the previous bull cycle, spanning 1061 days and producing a +2086% gain, this current rally shows signs of diminishing returns, a typical behaviour of maturing markets. Traders now face a critical question: has Bitcoin peaked for this cycle, or is another surge toward ~120K+ possible?
Historical Echoes: Elliott Wave Comparison
The 2018–2021 bull market formed a five-wave Elliott structure. That cycle ended with a -77.5% correction. The current cycle similarly traces out a completed five-wave advance from the $15.5K low, suggesting we may now be in a corrective phase.
Current hypothesis: Bitcoin is in Wave B of an ABC correction, with Wave C potentially targeting $64K–$70K.
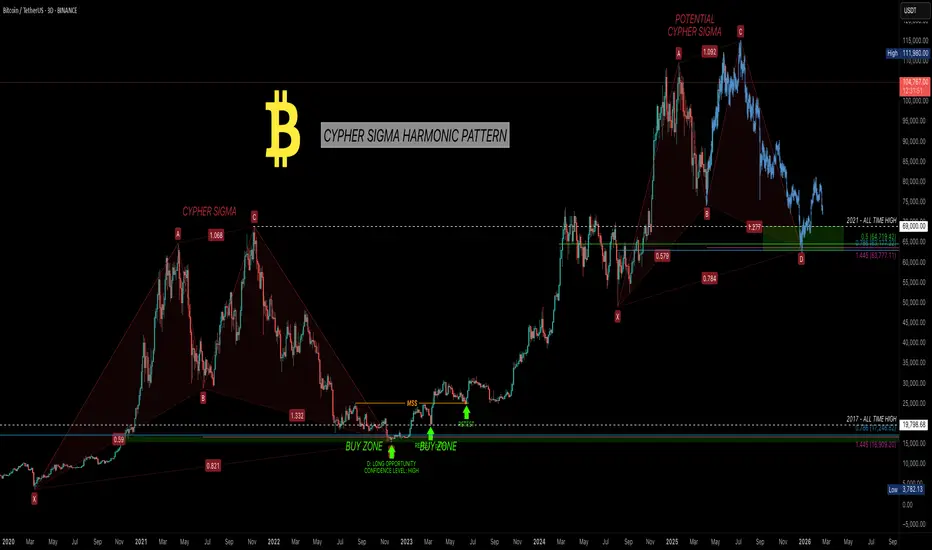
Harmonic Confirmation: Cypher Sigma Pattern
A refined harmonic formation, I call it the Cypher Sigma Harmonic Pattern (CSHP) and it has proven highly effective in volatile assets like Bitcoin. It differs from the classic Cypher by:


In 2022, this pattern predicted the bottom near $16K. Currently, another Cypher Sigma is potentially forming, pointing to a possible correction to ~$64K. This target aligns with historical level (the 2021 ATH zone) and represents a possible -40% pullback.

Multi-Layered Technical Confluence


Together, these tools strongly support the hypothesis of a macro top forming.
Fair Value Trend Model (FVTM) – New Indicator
As part of ongoing research into Bitcoin’s long-term valuation, I developed the Fair Value Trend Model—a logarithmic regression-based indicator tailored for Bitcoin. Here is an example on the monthly timeframe.

Key Features:
I have just freshly published this indicator for free on TradingView. Visit my profile, add it to your chart, and explore how Bitcoin consistently revisits its fair value in bear markets before launching new macro waves.
Use Cases:
The indicator is best used on daily, weekly and monthly charts, and it supports both all-time and rolling-window modes.
Educational Insight:
The Fair Value Trend Model isn’t just a tool! It's a lens to view the long-term rhythm of the Bitcoin market. By understanding where the fair value lies, you gain the clarity to separate short-term volatility from long-term opportunity.
Every great trader starts with a desire to understand. If you're learning, experimenting, and observing patiently—you’re on the right path. Let this model be your guide through the noise. Trust the math, respect the cycles, and never stop refining your edge.
Study day and swing trading, improve your technical and psychological skills, and wait patiently for high-probability trade setups, whether short-, medium-, or long-term. Being patient is key.
Psychological Insight: Mastery Over Impulse
The greatest returns favour the patient. Traders who ignored the noise in 2022 and accumulated around $16K were rewarded exponentially. As Bitcoin potentially enters a correction, the same principle applies: monitor, learn, and prepare—not panic.
Top-tier traders execute based on structure, not emotion. This cycle will reward those who:
-> Study multi-timeframe confluences
Outlook: Bearish Retracement, Bullish Opportunity
While a push to $120K+ is possible, the confluence of Elliott Wave, harmonic patterns, and macro tools suggest a potential 40% retracement into ~$64K by end of 2025/early 2026. This aligns with historical patterns and may offer a great buying opportunity.
This cycle isn’t about catching the exact top—it’s about navigating it intelligently. Use tools that reflect structural value, not just reactive price action. Combine the Fair Value Trend Model with other tools to gain clarity. Most importantly: remain curious, remain disciplined.
Happy trading.
Thanks for reading =) stay sharp, stay patient, and keep evolving 🚀
_________________________________
If you found this helpful, leave a like and comment below! Got requests for the next technical analysis? Let me know.
When compared to the previous bull cycle, spanning 1061 days and producing a +2086% gain, this current rally shows signs of diminishing returns, a typical behaviour of maturing markets. Traders now face a critical question: has Bitcoin peaked for this cycle, or is another surge toward ~120K+ possible?
Historical Echoes: Elliott Wave Comparison
The 2018–2021 bull market formed a five-wave Elliott structure. That cycle ended with a -77.5% correction. The current cycle similarly traces out a completed five-wave advance from the $15.5K low, suggesting we may now be in a corrective phase.
Current hypothesis: Bitcoin is in Wave B of an ABC correction, with Wave C potentially targeting $64K–$70K.
Harmonic Confirmation: Cypher Sigma Pattern
A refined harmonic formation, I call it the Cypher Sigma Harmonic Pattern (CSHP) and it has proven highly effective in volatile assets like Bitcoin. It differs from the classic Cypher by:
- BC projection: 1.07–1.136 of XA (vs. 1.272–1.414)
- CD retracement: 0.786–0.886 of XC
- BD extension: 1.272–1.618 of BC (not present in traditional Cypher but often targets 1.272-2.0)
In 2022, this pattern predicted the bottom near $16K. Currently, another Cypher Sigma is potentially forming, pointing to a possible correction to ~$64K. This target aligns with historical level (the 2021 ATH zone) and represents a possible -40% pullback.
Multi-Layered Technical Confluence
- Pitchfork Resistance: Bitcoin rejected the upper resistance (Fib 1.0–1.136 zone)
- Pitchfork Golden Pocket Support: ~$64K matches the golden pocket and high-liquidity area
- Fibonacci Circles: Rejection precisely at the 1.618–1.65 circle arc (~$112K)
- Speed Fan 0.618: Key structural support intersects projected retracement zone
- Previous 2021 ATH
Together, these tools strongly support the hypothesis of a macro top forming.
Fair Value Trend Model (FVTM) – New Indicator
As part of ongoing research into Bitcoin’s long-term valuation, I developed the Fair Value Trend Model—a logarithmic regression-based indicator tailored for Bitcoin. Here is an example on the monthly timeframe.
Key Features:
- Computes a log-log regression: ln(Price) vs ln(Days since inception)
- Yields a power-law growth curve: F(t) = C · [d(t)]^b
- Includes dynamic channel bands at user-defined percentage offsets
- Projects the trend forward in time with linear extrapolation
I have just freshly published this indicator for free on TradingView. Visit my profile, add it to your chart, and explore how Bitcoin consistently revisits its fair value in bear markets before launching new macro waves.
Use Cases:
- Identify overextensions above the fair value channel
- Spot mean-reversion setups near the lower channel band
- Gauge long-term trend continuation via slope and forecast
The indicator is best used on daily, weekly and monthly charts, and it supports both all-time and rolling-window modes.
Educational Insight:
The Fair Value Trend Model isn’t just a tool! It's a lens to view the long-term rhythm of the Bitcoin market. By understanding where the fair value lies, you gain the clarity to separate short-term volatility from long-term opportunity.
Every great trader starts with a desire to understand. If you're learning, experimenting, and observing patiently—you’re on the right path. Let this model be your guide through the noise. Trust the math, respect the cycles, and never stop refining your edge.
Study day and swing trading, improve your technical and psychological skills, and wait patiently for high-probability trade setups, whether short-, medium-, or long-term. Being patient is key.
Psychological Insight: Mastery Over Impulse
The greatest returns favour the patient. Traders who ignored the noise in 2022 and accumulated around $16K were rewarded exponentially. As Bitcoin potentially enters a correction, the same principle applies: monitor, learn, and prepare—not panic.
Top-tier traders execute based on structure, not emotion. This cycle will reward those who:
-> Study multi-timeframe confluences
Outlook: Bearish Retracement, Bullish Opportunity
While a push to $120K+ is possible, the confluence of Elliott Wave, harmonic patterns, and macro tools suggest a potential 40% retracement into ~$64K by end of 2025/early 2026. This aligns with historical patterns and may offer a great buying opportunity.
This cycle isn’t about catching the exact top—it’s about navigating it intelligently. Use tools that reflect structural value, not just reactive price action. Combine the Fair Value Trend Model with other tools to gain clarity. Most importantly: remain curious, remain disciplined.
Happy trading.
Thanks for reading =) stay sharp, stay patient, and keep evolving 🚀
_________________________________
If you found this helpful, leave a like and comment below! Got requests for the next technical analysis? Let me know.
🏆 Mastering Fibonacci for precision trading
🔹 Sharing high-probability trade setups
⚡ Unlock the power of technical analysis!
🔹 Sharing high-probability trade setups
⚡ Unlock the power of technical analysis!
Related publications
Disclaimer
The information and publications are not meant to be, and do not constitute, financial, investment, trading, or other types of advice or recommendations supplied or endorsed by TradingView. Read more in the Terms of Use.