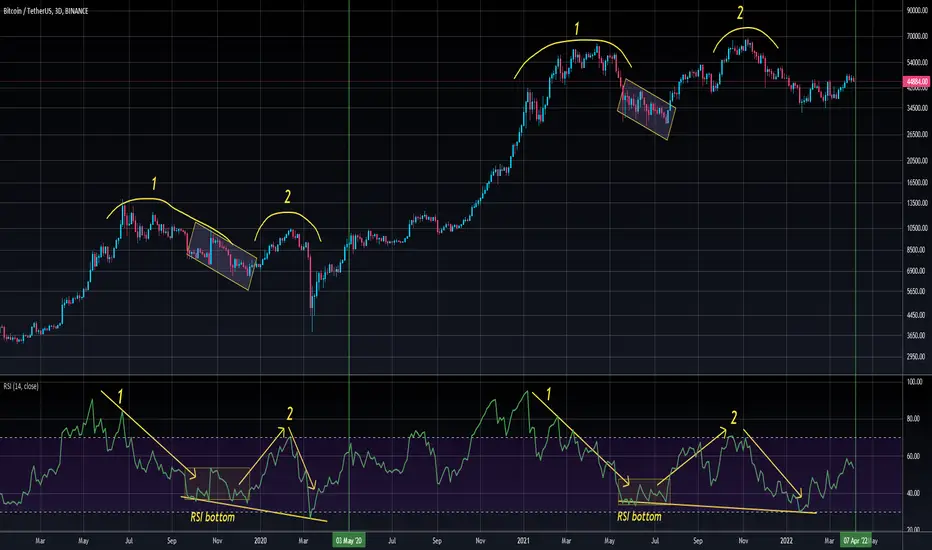
In february i wrote an idea called "Comparing 2019 mid cycle correction with 2020-2021 on 3D chart"
As an update i marked with green vertical line place where i think Bitcoin price is.
As we can see on the chart this structure still in play. This takes time and we should be patient.
As an update i marked with green vertical line place where i think Bitcoin price is.
As we can see on the chart this structure still in play. This takes time and we should be patient.
Related publications
Disclaimer
The information and publications are not meant to be, and do not constitute, financial, investment, trading, or other types of advice or recommendations supplied or endorsed by TradingView. Read more in the Terms of Use.
Related publications
Disclaimer
The information and publications are not meant to be, and do not constitute, financial, investment, trading, or other types of advice or recommendations supplied or endorsed by TradingView. Read more in the Terms of Use.