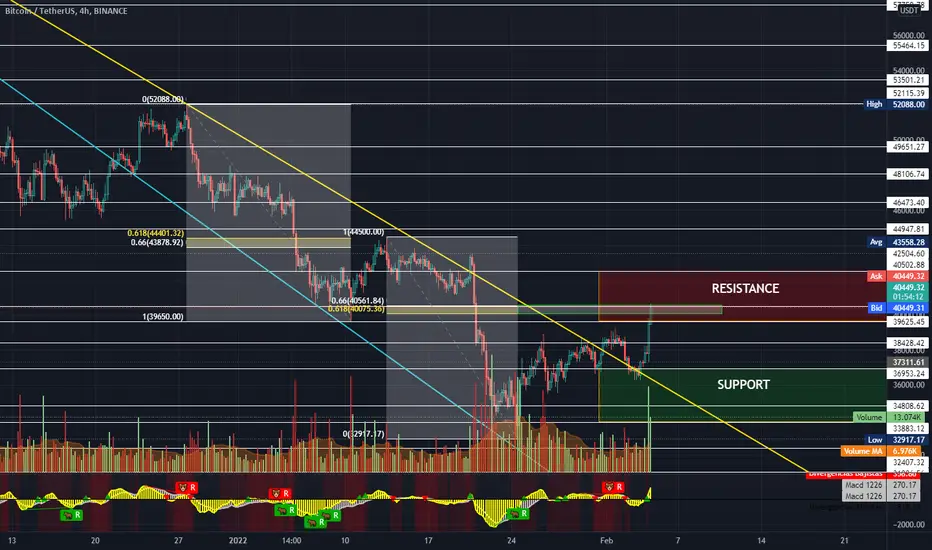
BTC/USDT Binance
4H hollow candlesticks.
The end of the market downtrend has occurred, since the price break out of the falling wedge.
The extension of Fibonacci retracement shows the main resistance area at $40.500.
The next Resistance level is at $42.500.
Volume is increasing.
Multiple Support & Resistance areas shown as horizontal lines.
Bitcoin Price (BTC) = $40,505.37 +10.00%
13.71 ETH -2.28%
Market Cap: $1,844,561,061,540
24h Vol: $82,869,202,859
Dominance: BTC: 41.5%
ETH: 19.1%
Good Luck
#Cryptohellas Team
Trade active
Resistance area is more accurate…Trade active
Indeed, a consolidation is happening between $41K—$42K.Price movement expected between the new Support & Resistance areas.
Seems that a Bart pattern is forming.
Trade active
Trade active
Price probably will follow the bar pattern repetition.Related publications
Disclaimer
The information and publications are not meant to be, and do not constitute, financial, investment, trading, or other types of advice or recommendations supplied or endorsed by TradingView. Read more in the Terms of Use.
Related publications
Disclaimer
The information and publications are not meant to be, and do not constitute, financial, investment, trading, or other types of advice or recommendations supplied or endorsed by TradingView. Read more in the Terms of Use.