Hi All,
This post is explaining why I"m still bullish for another leg up.
My Thoughts:
================================
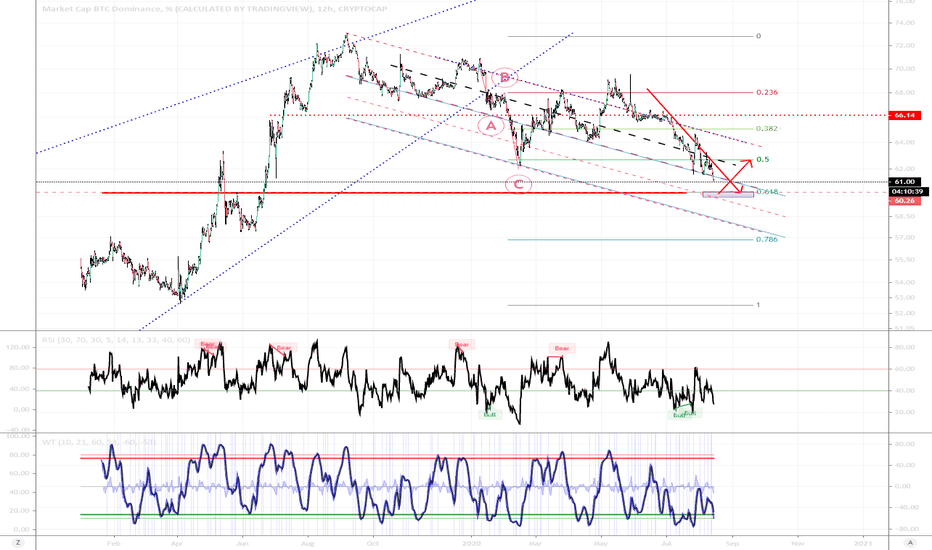
a) the previous post on BTC dominance explains why BTC dom is going to go up (Link below ) hitting the 0.618 retracement level
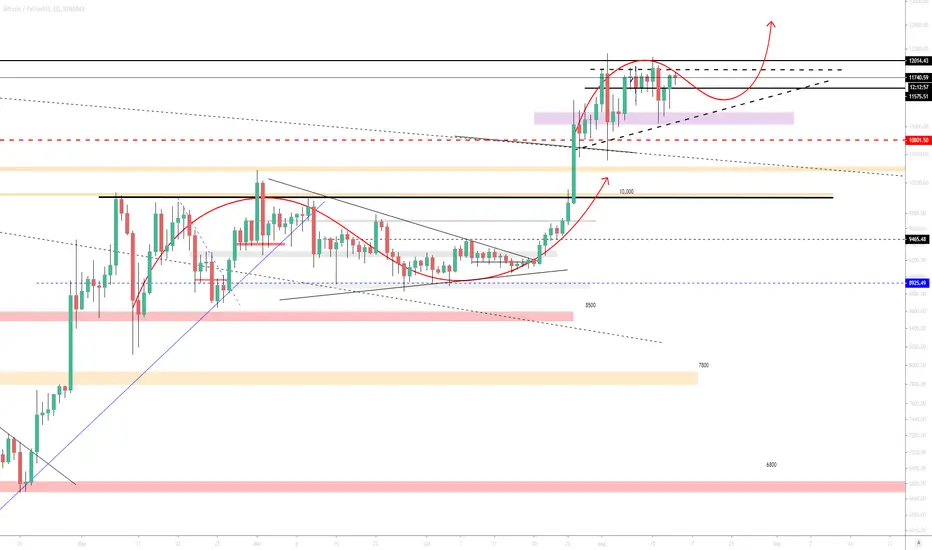
b) the chart above shows a structure accumulating under another key level of 12K, The next level up 12.5K and potentially 13.8K.
If it was to go bearish, 10500 and possibly 10200, which I see less likely but the case for not testing the 21 EMA is still there, but that can be after the next level up.
c) ETH to also ride the along with BTC
d) The current 11500 to 12000 formation, can be viewed as a bull flag.
e) Both indicators on the daily show momentum moving upwards.
f) Note the wicks of the daily candles, longer on the bottom showing upward pressure
g) Note the weekly chart and 2 days for the candle to close, another bullish sign
If it reaches 12500 or 13800 what ever the number, I then expect a big ABC correction to test the 21 or 34 EMA as it did historically
If you put the BTC dominance explanation along with this chart, its evident that BTC is going to be dominant via spike up or down.
Bitcoin to take the $12K & ETH for $477
Please give me a like or tick for this post
Cheers,
S.Sari
Close up view of current structure:
Note the levels it broke and what levels its testing > weekly resistance and support.
Shows the bullish and bearish scenarios.

Overview

BTC dominance post
Weekly chart

This post is explaining why I"m still bullish for another leg up.
My Thoughts:
================================
a) the previous post on BTC dominance explains why BTC dom is going to go up (Link below ) hitting the 0.618 retracement level
b) the chart above shows a structure accumulating under another key level of 12K, The next level up 12.5K and potentially 13.8K.
If it was to go bearish, 10500 and possibly 10200, which I see less likely but the case for not testing the 21 EMA is still there, but that can be after the next level up.
c) ETH to also ride the along with BTC
d) The current 11500 to 12000 formation, can be viewed as a bull flag.
e) Both indicators on the daily show momentum moving upwards.
f) Note the wicks of the daily candles, longer on the bottom showing upward pressure
g) Note the weekly chart and 2 days for the candle to close, another bullish sign
If it reaches 12500 or 13800 what ever the number, I then expect a big ABC correction to test the 21 or 34 EMA as it did historically
If you put the BTC dominance explanation along with this chart, its evident that BTC is going to be dominant via spike up or down.
Bitcoin to take the $12K & ETH for $477
Please give me a like or tick for this post
Cheers,
S.Sari
Close up view of current structure:
Note the levels it broke and what levels its testing > weekly resistance and support.
Shows the bullish and bearish scenarios.
Overview
BTC dominance post
Weekly chart
Note
The first test of the 20 period moving average on the daily was done but on the bitcoin XBTUSD Perpetual inverse swap contract chart.Hence this clears another checklist item for the bullish scenario.
Note
Target and resistance levelsNote
Their approach is sophisticated, at each key level, the longer they hold it there, the more likely they will liquidate people's holding. Just HODL, do not trade it.Note
12500 was my next target, close enough $12468. Now its going to be hard.I also have 13800, can the bulls hold this?
Note
The weekly MACD says we have more room to the upside. The RSI hasn't reached its resistance trend line. 13800 might be it?Discord: discord.com/invite/vb4hbP88vb (TradeToProspa)
Telegram: t.me/TprospaTradersbot
This community has signals now but with no risk management comms.
Telegram: t.me/TprospaTradersbot
This community has signals now but with no risk management comms.
Related publications
Disclaimer
The information and publications are not meant to be, and do not constitute, financial, investment, trading, or other types of advice or recommendations supplied or endorsed by TradingView. Read more in the Terms of Use.
Discord: discord.com/invite/vb4hbP88vb (TradeToProspa)
Telegram: t.me/TprospaTradersbot
This community has signals now but with no risk management comms.
Telegram: t.me/TprospaTradersbot
This community has signals now but with no risk management comms.
Related publications
Disclaimer
The information and publications are not meant to be, and do not constitute, financial, investment, trading, or other types of advice or recommendations supplied or endorsed by TradingView. Read more in the Terms of Use.