Long
BTG/USD showed oversold signs
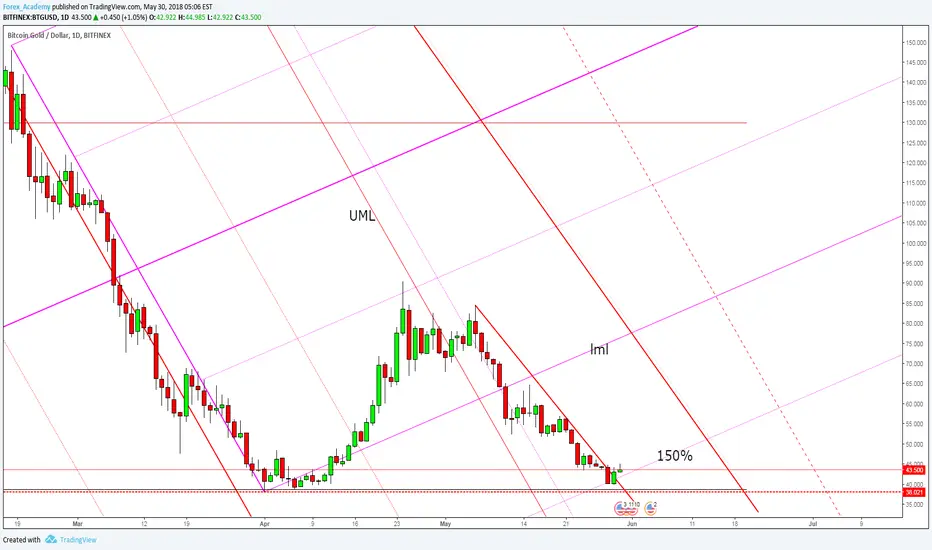
Price has made a false breakdown below the 150% Fibonacci line (ascending dotted line). It has failed to reach and retest the 38.050 static support and now it could increase if it stays above the 150% Fibonacci line. It is remature to talk about a larger upside movement right neow because the Crypto section is still under pressure.
The next upside target remains at the red downtrend line. A potential bullish movement will be invalidated by the breakdown below the 38.050 static support.
The next upside target remains at the red downtrend line. A potential bullish movement will be invalidated by the breakdown below the 38.050 static support.
Disclaimer
The information and publications are not meant to be, and do not constitute, financial, investment, trading, or other types of advice or recommendations supplied or endorsed by TradingView. Read more in the Terms of Use.
Disclaimer
The information and publications are not meant to be, and do not constitute, financial, investment, trading, or other types of advice or recommendations supplied or endorsed by TradingView. Read more in the Terms of Use.