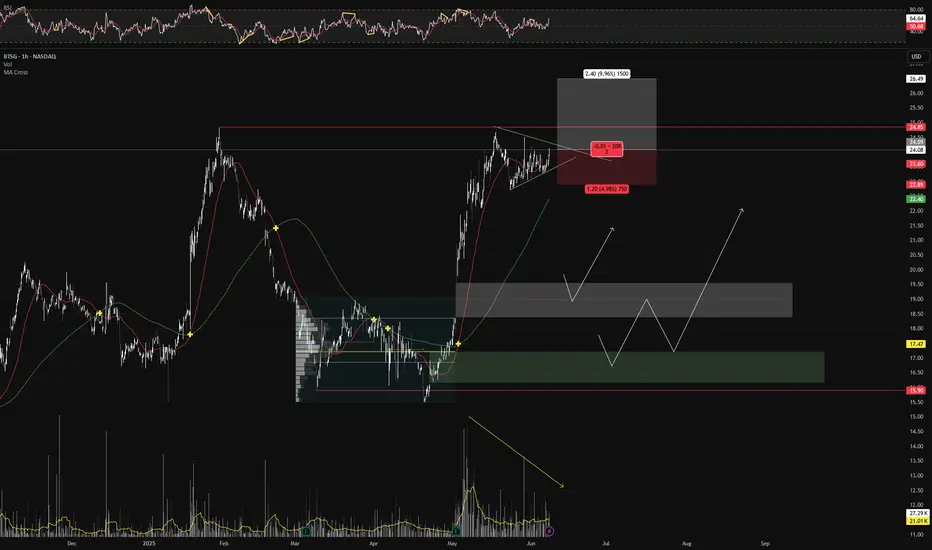
Current Price: $24.11
Change: +0.58 (+2.47%)
Volume: 1,529,511
52-Week Range: $17.50 – $24.50
Technical Overview:
Chart Pattern: Forming a bullish cup-with-handle pattern, indicating potential for a breakout.
Moving Averages:
50-Day MA: $22.80
200-Day MA: $21.50
Relative Strength Index (RSI): 65 – approaching overbought territory, but still within a bullish range.
Execution Plan:
Entry: $24.20
Stop Loss: $22.80
Take Profit: $26.50
Risk-Reward Ratio: 1:2
Rationale:
BrightSpring has surged approximately 38% in 2025, significantly outperforming the S&P 500. Analysts project a 269% increase in earnings per share this year, followed by 20% growth next year. The company recently sold its community living business to focus more on its pharmacy division and reduce debt.
ALL TIME HIGH TRADER
Disclaimer
The information and publications are not meant to be, and do not constitute, financial, investment, trading, or other types of advice or recommendations supplied or endorsed by TradingView. Read more in the Terms of Use.
ALL TIME HIGH TRADER
Disclaimer
The information and publications are not meant to be, and do not constitute, financial, investment, trading, or other types of advice or recommendations supplied or endorsed by TradingView. Read more in the Terms of Use.