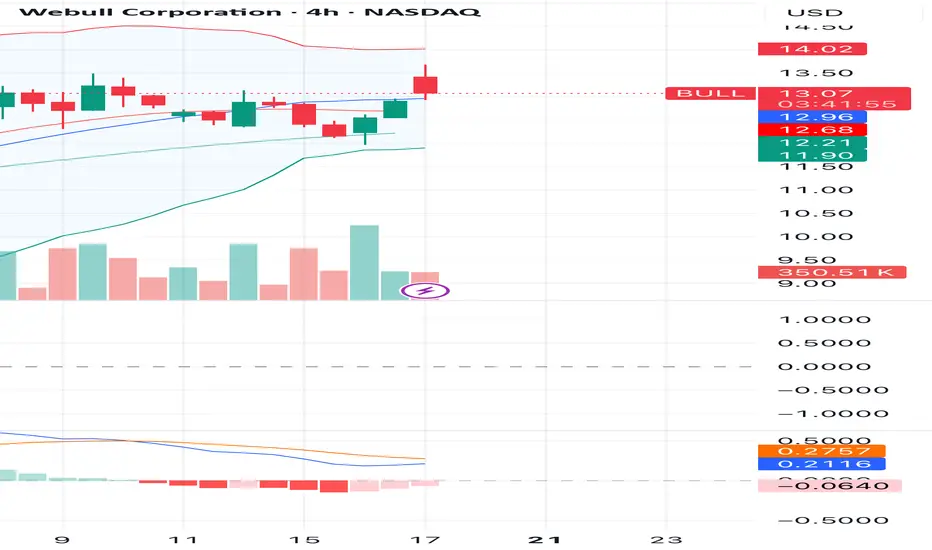
The 4H chart for Webull Corporation shows a strong bullish breakout candle above key moving averages, signaling potential for continued upside momentum. The price has closed above the middle Bollinger Band and is testing the upper band with increasing volume — a bullish sign supported by a recent uptick in MACD histogram.
🔹 Entry Point: $13.03
🔹 First Target (TP1): $14.01 (recent resistance)
🔹 Second Target (TP2): $15.50 (projected breakout range)
🔹 Stop Loss: $12.68 (below support and MA)
This setup indicates a possible short-term rally, especially if volume continues to rise. Monitor closely for follow-through and watch for potential pullbacks to the 12.90–13.00 area as a re-entry zone.
Disclaimer
The information and publications are not meant to be, and do not constitute, financial, investment, trading, or other types of advice or recommendations supplied or endorsed by TradingView. Read more in the Terms of Use.
Disclaimer
The information and publications are not meant to be, and do not constitute, financial, investment, trading, or other types of advice or recommendations supplied or endorsed by TradingView. Read more in the Terms of Use.