Long
BurgerCities (BURGER) - higher low
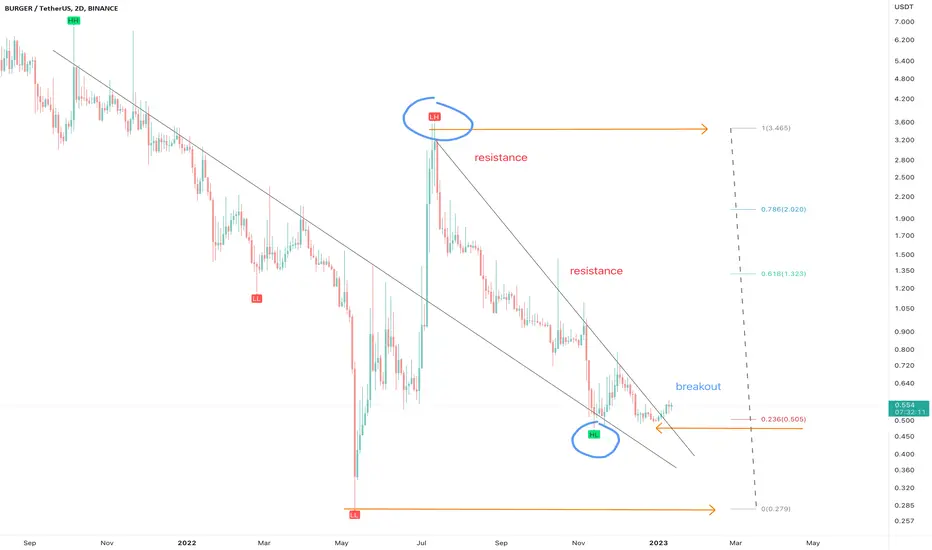
On the above 2-day chart price action has collapsed over 80% since the sell signal in July (not shown). A number of reasons now exist to be long, including:
1) A strong buy signal (not shown).
2) A higher low has printed (on both USD and BTC pairs).
3) The high prints on the Fibonacci 0.236 level.
4) Price action resistance breakout.
Is it possible price action falls further? Sure.
Is it probable? No
Ww
Type: trade
Risk: <=6% of portfolio
Timeframe: Don’t know.
Return: 6x / $3 at first
Trade active
Note
Past resistance confirms support.BTC
bc1q2eckdzh0q8vsd7swcc8et6ze7s99khhxyl7zwy
Weblink: patreon.com/withoutworries
Allow 3-6 months on ideas. Not investment advice. DYOR
bc1q2eckdzh0q8vsd7swcc8et6ze7s99khhxyl7zwy
Weblink: patreon.com/withoutworries
Allow 3-6 months on ideas. Not investment advice. DYOR
Disclaimer
The information and publications are not meant to be, and do not constitute, financial, investment, trading, or other types of advice or recommendations supplied or endorsed by TradingView. Read more in the Terms of Use.
BTC
bc1q2eckdzh0q8vsd7swcc8et6ze7s99khhxyl7zwy
Weblink: patreon.com/withoutworries
Allow 3-6 months on ideas. Not investment advice. DYOR
bc1q2eckdzh0q8vsd7swcc8et6ze7s99khhxyl7zwy
Weblink: patreon.com/withoutworries
Allow 3-6 months on ideas. Not investment advice. DYOR
Disclaimer
The information and publications are not meant to be, and do not constitute, financial, investment, trading, or other types of advice or recommendations supplied or endorsed by TradingView. Read more in the Terms of Use.