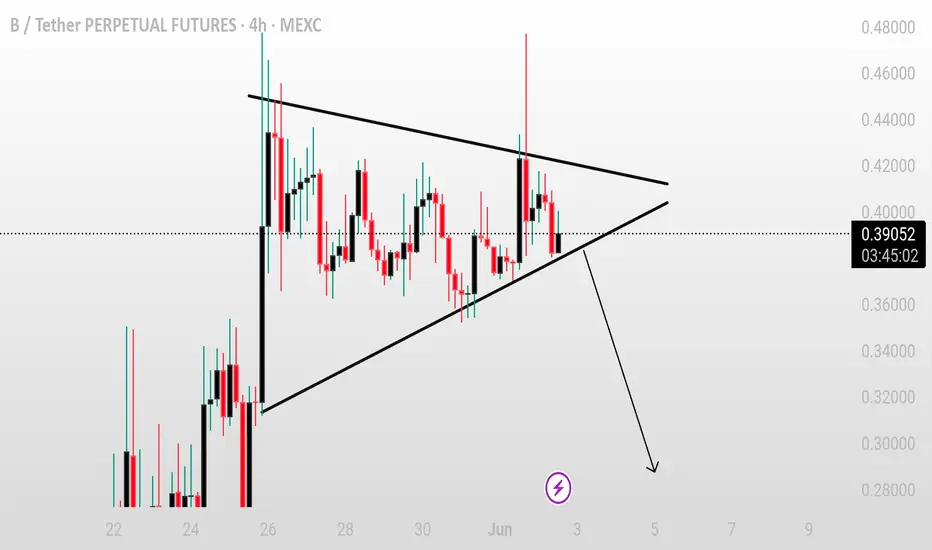
BUSDT/USDT – Symmetrical Triangle Breakdown Setup
BUSDT is currently trading within a symmetrical triangle pattern on the 4H timeframe, indicating price compression and a possible breakout or breakdown ahead. The price is now hovering near the lower trendline, and pressure is building up.
A clean breakdown below the support trendline with volume could confirm bearish continuation, opening the door for further downside. The projected move, if breakdown confirms, could lead price towards the next key support zones.
**Key Points:**
* Triangle formation tightening
* Watch for 4H candle close below the support line
* Breakdown confirmation could trigger a short setup
Keep this pair on your radar — confirmation and volume are key to validating the move.
🚀 Join My Telegram Community for FREE trading signals, entry/exit points, and instant updates!
👉 t.me/cryptobyghazii
👉 t.me/cryptobyghazii
Disclaimer
The information and publications are not meant to be, and do not constitute, financial, investment, trading, or other types of advice or recommendations supplied or endorsed by TradingView. Read more in the Terms of Use.