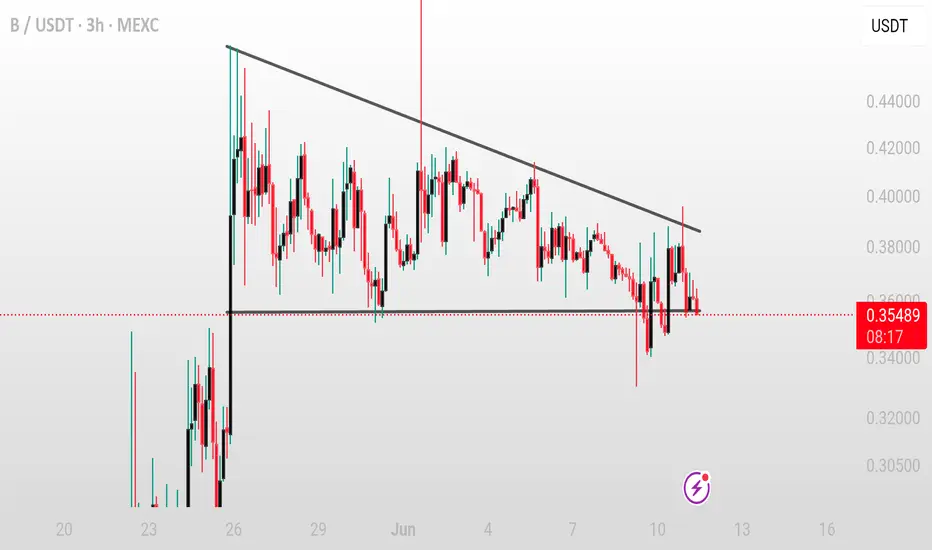
B/USDT – Descending Triangle Breakdown
pattern: descending triangle
timeframe: 3H ⏱️
status: support broken – breakdown in progress ⚠️
idea:
B has broken below key horizontal support at 0.3500–0.3550. If price sustains below and rejects this level on retest, further downside is likely 🔻
entry (confirmation): below 0.3500 or on retest rejection ❗
targets:
– tp1: 0.3300 🎯
– tp2: 0.3100 🎯
– tp3: 0.2900 or lower 🎯
stop loss: above 0.3650 or recent breakdown candle 🛑
note: breakdown with low volume could be a fakeout, wait for confirmation ⚠️
🚀 Join My Telegram Community for FREE trading signals, entry/exit points, and instant updates!
👉 t.me/cryptobyghazii
👉 t.me/cryptobyghazii
Disclaimer
The information and publications are not meant to be, and do not constitute, financial, investment, trading, or other types of advice or recommendations supplied or endorsed by TradingView. Read more in the Terms of Use.