📊
⏱️ Timeframe:
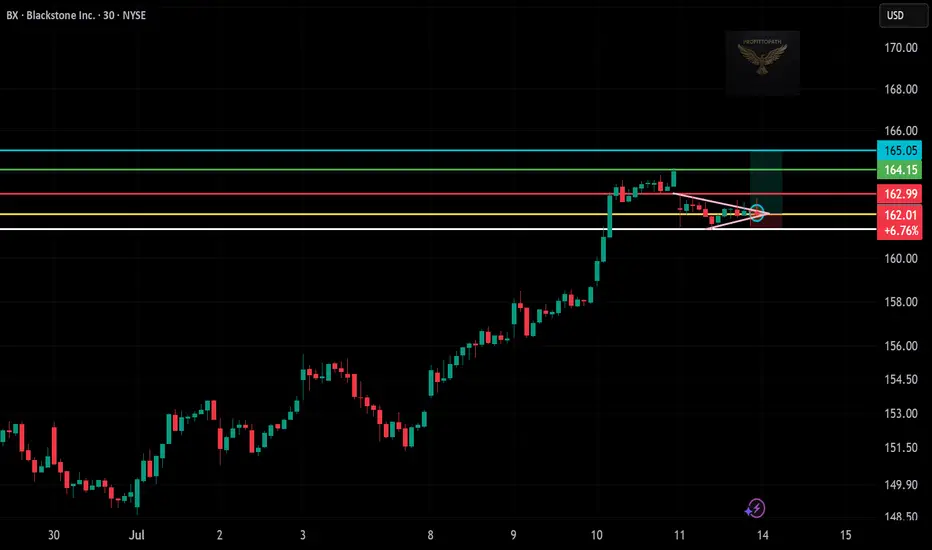
30-minute chart
📍 Technical Highlights:
Bullish pennant breakout forming after a strong uptrend (continuation pattern ✅)
Breakout area: Around $163 (red resistance)
Support held near $162 zone (white/yellow lines)
🎯 Targets:
TP1: $164.15
TP2: $165.05
(Both resistance levels marked in light blue)
🔐 Risk Management:
Entry: ~$163 (after pennant breakout confirmation)
Stop Loss: Below $161.80 (tight risk)
Risk–Reward Ratio: Excellent (>2:1)
⏱️ Timeframe:
30-minute chart
📍 Technical Highlights:
Bullish pennant breakout forming after a strong uptrend (continuation pattern ✅)
Breakout area: Around $163 (red resistance)
Support held near $162 zone (white/yellow lines)
🎯 Targets:
TP1: $164.15
TP2: $165.05
(Both resistance levels marked in light blue)
🔐 Risk Management:
Entry: ~$163 (after pennant breakout confirmation)
Stop Loss: Below $161.80 (tight risk)
Risk–Reward Ratio: Excellent (>2:1)
Disclaimer
The information and publications are not meant to be, and do not constitute, financial, investment, trading, or other types of advice or recommendations supplied or endorsed by TradingView. Read more in the Terms of Use.
Disclaimer
The information and publications are not meant to be, and do not constitute, financial, investment, trading, or other types of advice or recommendations supplied or endorsed by TradingView. Read more in the Terms of Use.