Technical Analysis
Analysis Method: Fibonacci & Wave Theory
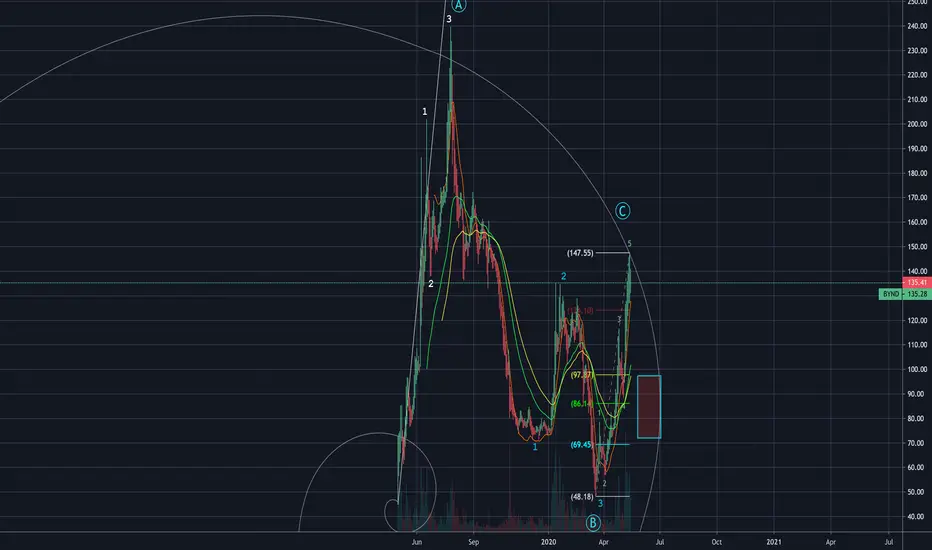
The chart shows that BYND is currently building a base in an ABC Correction sequence. Currently, BYND is in the C Wave Position.
Expect a .618 Fibonacci Retracement from current levels.
Target Area: $97-$69
Time-Frame: 49 Days
Fibonacci Technical Analysis:
Find more analysis on FibMarketWatch.com
Related publications
Disclaimer
The information and publications are not meant to be, and do not constitute, financial, investment, trading, or other types of advice or recommendations supplied or endorsed by TradingView. Read more in the Terms of Use.
Related publications
Disclaimer
The information and publications are not meant to be, and do not constitute, financial, investment, trading, or other types of advice or recommendations supplied or endorsed by TradingView. Read more in the Terms of Use.