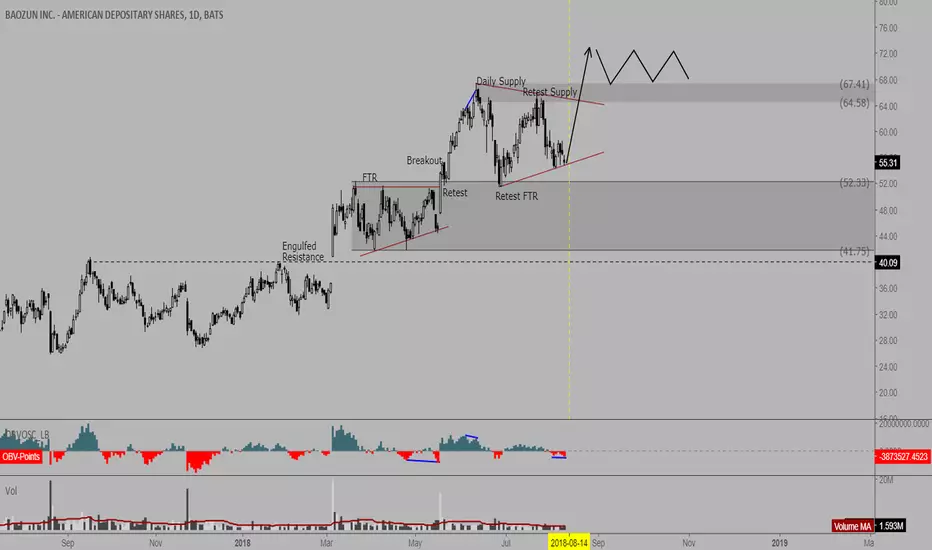
BZUN has been a price action dream
Similar setup to last earnings, bull div on daily going into earnings on 8/14
Buy in anticipation or buy the retest
Similar setup to last earnings, bull div on daily going into earnings on 8/14
Buy in anticipation or buy the retest
Note
Bull div invalidated, if earnings dump $46-47 (200 EMA + FTR EQ + Gap fill) would be a good place for a bounce
Will update EOD
Note
Here's my bias
Sell stops sweeped, as long as this daily closes above previous swing low we have a swing failure
T1: 58 (in line with expected move)
T2: 64
Note
Looks good
Note
Lol, T1 hit
Imagine doing all this FA reading about earnings and China when you could've made this trade just through pure price action
Note
That said it looks toppy as hell with that giant profit taking candle, weekly EMA downtrending, generally low volumeNote
Trying to make sense of this price action
If daily candle closes neutral, this action was to stop out shorts, then longs, then reverse at .705 OTE leaving retail behind
If candle still looks this ugly EOD, probable push lower to 200 EMA / .786 fib / FTR EQ / Gap Fill before bounce. Whether it's sustainable or not is a different question.
Note
I'd bet on a bounce here, gap filled, 200D EMA, a lot of distance from 5 EMA
Note
Would be looking at this daily breaker in red to exit any underwater positions
Note
If you like Elliott Waves, interesting confluence
Clear 5 waves up
Currently making a zigzag, extension in yellow
Gap we just filled corresponds to 1.272 extension
Black fib retrace, areas I'm interested in in white
.382 corresponds to 55W EMA
.5 corresponds to 89W EMA + Gap on daily
.65 corresponds to low of wave 4
.705 corresponds to 2.618 ext of current zigzag
All would make for good bounces
Note
Old private ideas: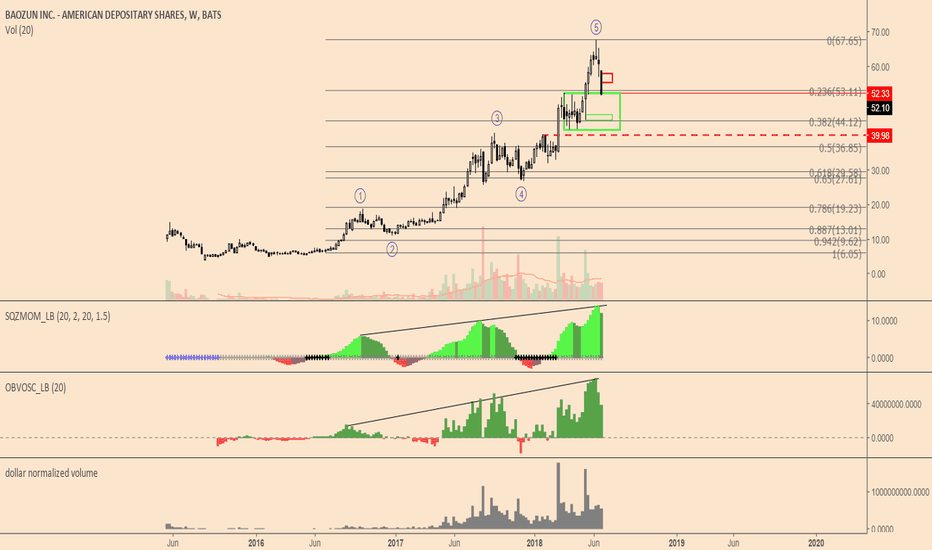
Note
:thinkingemoji:
Note
Note
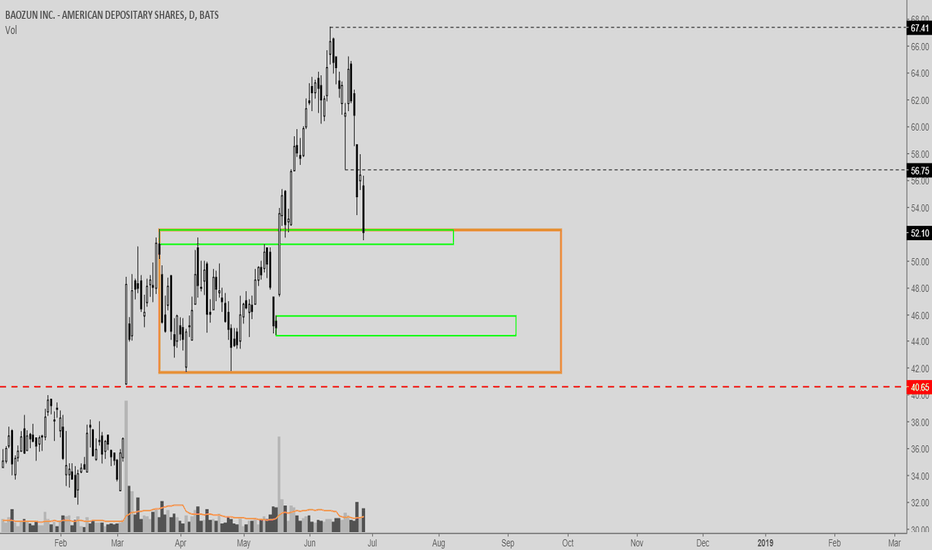
Bias:
Bull volume MIA, likely going down
Probably bounce from 200D EMA on second test, if weaker bounce than current one, likely to go deeper into this weekly demand zone (FTR used in previous analysis is redundant with this weekly demand zone so taken off)
Weekly market structure is bearish so I'm leaning toward price going lower
If we go lower:
Clean lows at 44.55, expecting sweep of sell stops under and bounce from 55W EMA
Note
Bull Case:
Almost at historical weekly RSI support
Breakout and retest of it started the parabolic run
Nicely proportioned zigzag since the top could mark a reversal
BUT would be less than a .382 retracement which is very rare and only in very bullish cases; this doesn't look that bullish to me
Breakout down from 48 RSI and retest seems more likely
Interesting to note: RSI caught the bear div at the top, OBVOSC didn't
Note
That low volume double top is clearly distribution in hindsightNote
Note
Easy intraday fade here
Note
Biggest mistake so far was to underestimate the bounce and expecting resistance at a low TF structure.
Weekly perspective shows a clear 'Nose' acting as resistance from the bounce off 200D EMA.
Anemic volume to the upside suggests relief rally before continuation.
Bias is down until proven otherwise, re-evaluating after a close above 58.66
Note
Broke below, retested, and rejected weekly open
Note
Here's BABA which BZUN is obviously correlated to...
US indices to look like this soon...
Note
Bidding 42-44, 37-41
T1 47.5
T2 52.5
SL 35.5
Crappy RRR but very high probability
Note
Market bought into that big dip into 43's, how confident are you in your game plan?Note
Knowing when to sit on your hands is the most underrated part of trading. Instant 5%, could technically sell and have made enough for the week but will ride to target. Holding a position when there's no clarity is a massively understated risk...
Note
Eyes on weekly RSI for SR flip before continued downside
Note
Note
Difference is the bear div forming on 15 min chart, but still think a bounce off first test of 55W EMA goes higher than this.
Note
JD relief rally confluence
Note
Whoops, tweezer bottom is referring to the weekly chart, still early though
Bull div on 4H but not 1D/1W so not expecting trend reversal on this bounce
Note
SHCOMP confluence
Note
Note
Ran out of free indicator space on my main layout so opened up this old one from August to throw ATR bands (20,20) on top
First red circle is tap of -3 ATR before bounce to slightly below +1 ATR
Second circle is our current tweezer bottom + hammers + swing failure pattern which is obviously bullish af, wicked to slightly above -3 ATR, target previously mentioned is consistent with a bounce to +1 ATR
All in tomorrow ^^
Note
Looks like price is running away premarket, not gonna get to add :'( Already sized pretty aggressively so not the biggest deal
Note
Adding in blue sd flip if price lets me
+9% in 2 days
Keep in mind your HTF bias and don't let it be shaken by what you see on LTF, I was 75% confident that the 15 min bear div would not invalidate my HTF bias, so that dip yday should logically be just to shake out late longs
Didn't TP at 47.5 like planned, this move is very likely going to >52, I'll just trail some stops
Note
Game plan, dip into blue, end day neutral, print a nice weekly reversal candle
Note
Most volatility is in opening and closing hour, probably won't get to add where I wantNote
Swish
Note
E: 46.05T: 52
S: Under 4H SFP
Think that's about double digit RRR...
Note
Bear engulfing daily has something like a 70% strike rate for more downside on BZUN, want to see close at least above 50% of this weekly range. On the flipside, this bearish engulfing is on low volume, potential shakeout. Staying in positions over the weekend.Disclaimer
The information and publications are not meant to be, and do not constitute, financial, investment, trading, or other types of advice or recommendations supplied or endorsed by TradingView. Read more in the Terms of Use.
Disclaimer
The information and publications are not meant to be, and do not constitute, financial, investment, trading, or other types of advice or recommendations supplied or endorsed by TradingView. Read more in the Terms of Use.