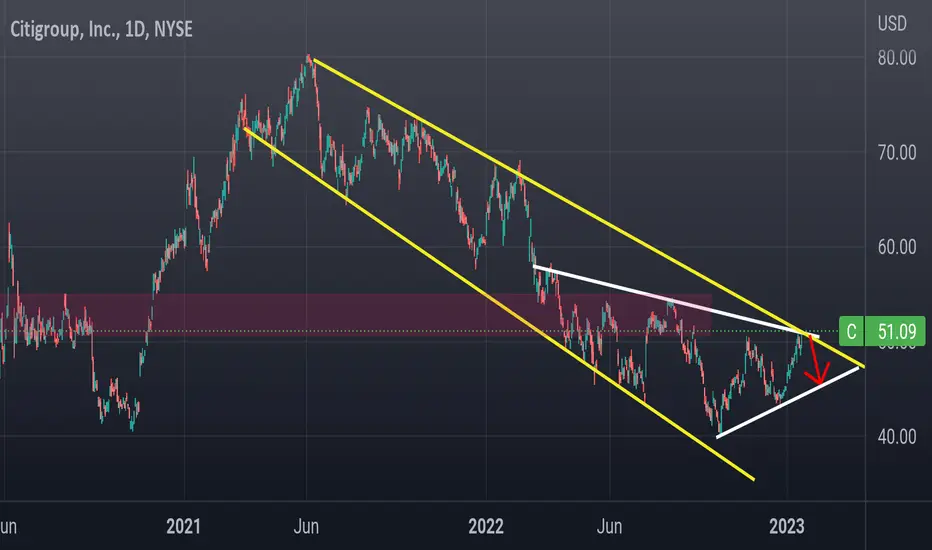
Short target 45$
Stop loss 54
CCI and Moneyflow is telling me any leg higher is a fake out
Notice how the formation in the white trendline is similar to the spy daily chart?
If you go back and look at the charts here between 2020 and 2021 , you'll see alot of resistance around 53: similar in 2022.
Stop loss 54
CCI and Moneyflow is telling me any leg higher is a fake out
Notice how the formation in the white trendline is similar to the spy daily chart?
If you go back and look at the charts here between 2020 and 2021 , you'll see alot of resistance around 53: similar in 2022.
Related publications
Disclaimer
The information and publications are not meant to be, and do not constitute, financial, investment, trading, or other types of advice or recommendations supplied or endorsed by TradingView. Read more in the Terms of Use.
Related publications
Disclaimer
The information and publications are not meant to be, and do not constitute, financial, investment, trading, or other types of advice or recommendations supplied or endorsed by TradingView. Read more in the Terms of Use.