Bullish Case
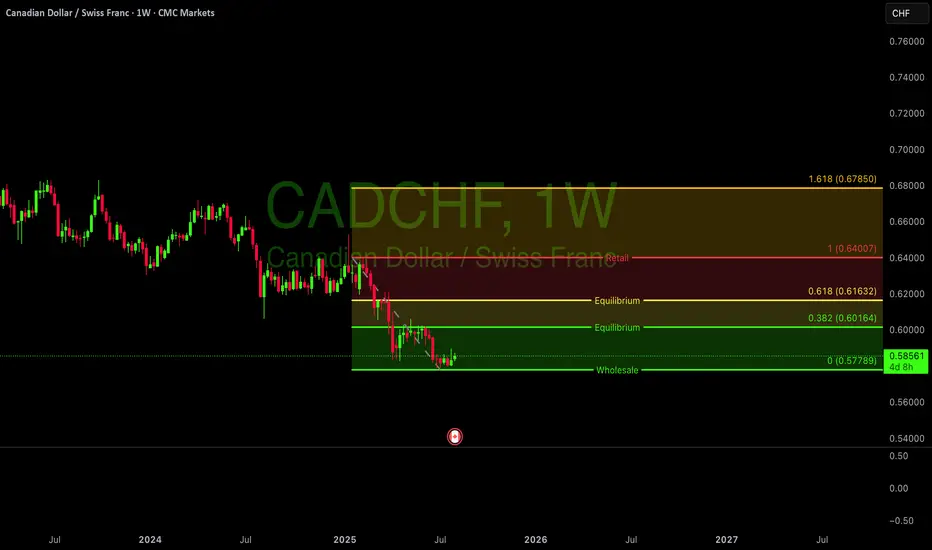
Consolidation at Key Support: Price has been consolidating between 0.579-0.583 for several weeks, showing resilience at this level. This suggests a potential exhaustion of the downtrend.
Higher Lows Formation: Looking at the recent 4-hour chart, we can see a series of higher lows forming since July 30th, indicating increasing buying pressure.
Potential Double Bottom: The price action in late July shows a potential double bottom formation around 0.579-0.580, which is a classic reversal pattern.
Momentum Shift: Recent price action shows increased volatility with bullish candles gaining more ground than bearish ones, suggesting a potential shift in momentum.
Trade Setup
Entry Strategy:
Primary Entry: Buy at current market price (0.585-0.586)
Alternative Entry: Wait for a pullback to 0.582-0.583 support zone and enter on signs of bullish rejection (hammer, engulfing)
Stop Loss:
Place stop loss below the recent low at 0.578 (approximately 0.577 for buffer)
This represents a risk of about 80-90 pips
Take Profit Targets:
First Target: 0.595 (Key resistance level) - 100 pips profit
Second Target: 0.608-0.614 (Strong demand zone identified earlier) - 230-290 pips profit
Final Target: 0.628-0.635 (Supply zone) - 430-500 pips profit
Risk-to-Reward Ratio:
First target: 1:1.25
Second target: 1:2.9
Final target: 1:5.4
Trade Management
Partial Profit Taking: Consider taking 50% off at first target, 30% at second target, and let 20% run for the final target.
Stop Loss Adjustment: Move stop loss to breakeven after price reaches halfway to first target (around 0.590).
Time Frame: This is a medium-term swing trade with an expected duration of 3-8 weeks.
Catalysts to Watch
Swiss National Bank Policy: Any dovish signals from the SNB could weaken CHF and accelerate the bullish move.
Canadian Economic Data: Strong Canadian economic data, particularly in energy and commodities sectors, could strengthen CAD.
Risk Sentiment: Improvement in global risk sentiment typically benefits CAD over the safe-haven CHF.
Warning Signs to Exit Early
Break Below Support: If price decisively breaks below 0.578 with increased momentum.
Failure to Make Higher Highs: If price action fails to continue the pattern of higher highs and higher lows on the 4-hour chart.
Rejection at 0.590: Strong rejection at the 0.590 level could indicate the bullish momentum is fading.
This bullish trade idea for ^CADCHF is based on technical evidence of a potential trend reversal after a prolonged downtrend. The favorable risk-to-reward ratio makes this an attractive opportunity, with multiple profit targets allowing for flexible trade management.
Disclaimer
The information and publications are not meant to be, and do not constitute, financial, investment, trading, or other types of advice or recommendations supplied or endorsed by TradingView. Read more in the Terms of Use.
Disclaimer
The information and publications are not meant to be, and do not constitute, financial, investment, trading, or other types of advice or recommendations supplied or endorsed by TradingView. Read more in the Terms of Use.