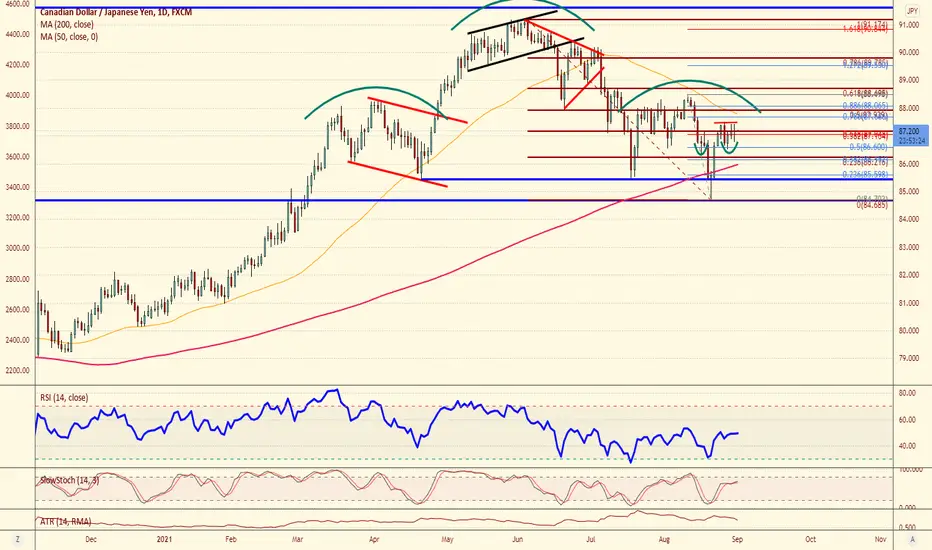
On August 16th, the CADJPY was our "Chart of the Day" (forexanalytix.com/blog/chart-of-the-day-aug-16th-2021/) and the pair was expected to develop the neckline of a possible longer term head and shoulder pattern. The pair did just that, but did a little more than expected. On that drop following August 16th, the pair fell to a low of the 84.67 level and bounced. The problem with this move is that created a "false breakdown" below the key 85.30 support and may have created a near term INVERSE head and shoulder pattern. If this pattern plays out we could rally towards the 88.50-89.00 level near term. With stocks at all time highs, the risk of a move higher from here is heightened.
Community - forexanalytix.com/sign_in
Prop trade with Forex Analytix - bit.ly/3t0NdRB
Forex Analytix Community Experience - forexanalytix.com/webinars/face/sign_up
Prop trade with Forex Analytix - bit.ly/3t0NdRB
Forex Analytix Community Experience - forexanalytix.com/webinars/face/sign_up
Disclaimer
The information and publications are not meant to be, and do not constitute, financial, investment, trading, or other types of advice or recommendations supplied or endorsed by TradingView. Read more in the Terms of Use.