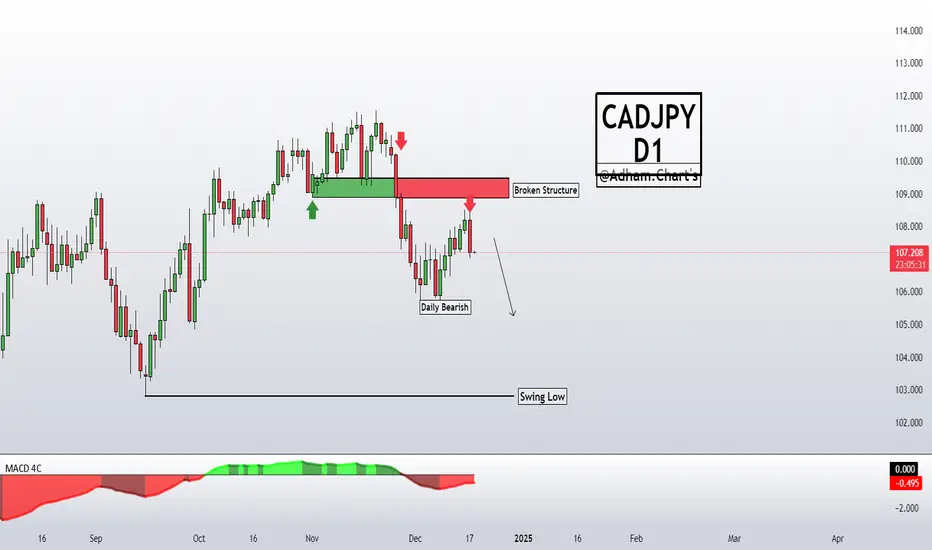
💡The chart shows technical analysis of the CAD/JPY currency pair on the daily time frame (D1). The trend is down unless the resistance (red area) is breached. The current resistance area (red color) enhances selling opportunities. The MACD indicator shows that the positive momentum (green) has declined after rising.
⛔️It is not investment advice for educational purposes only.
⛔️It is not investment advice for educational purposes only.
Disclaimer
The information and publications are not meant to be, and do not constitute, financial, investment, trading, or other types of advice or recommendations supplied or endorsed by TradingView. Read more in the Terms of Use.
Disclaimer
The information and publications are not meant to be, and do not constitute, financial, investment, trading, or other types of advice or recommendations supplied or endorsed by TradingView. Read more in the Terms of Use.