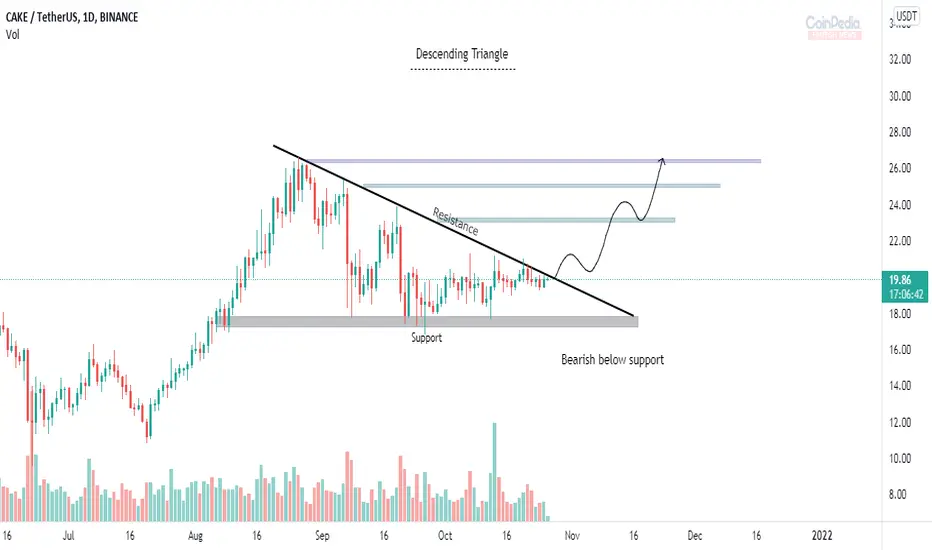
* Cake in Daily time frame appears with Descending triangle, with it's resistance as above trendline and the support zone around $17.
* Descending triangle is considered to be either trend continuation or trend reversal pattern depend on the breakout.
* If CAKEUSDT breaks it's above resistance, we can expect bullish momentum.
* Price is bearish below support.
* Descending triangle is considered to be either trend continuation or trend reversal pattern depend on the breakout.
* If CAKEUSDT breaks it's above resistance, we can expect bullish momentum.
* Price is bearish below support.
Note
Breakout of resistanceDisclaimer
The information and publications are not meant to be, and do not constitute, financial, investment, trading, or other types of advice or recommendations supplied or endorsed by TradingView. Read more in the Terms of Use.
Disclaimer
The information and publications are not meant to be, and do not constitute, financial, investment, trading, or other types of advice or recommendations supplied or endorsed by TradingView. Read more in the Terms of Use.