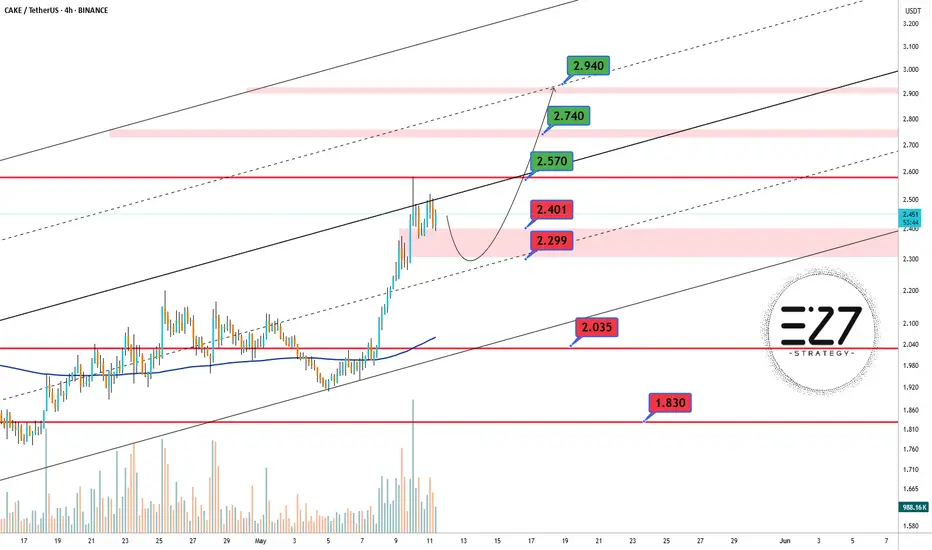
📊 On the 4HCAKEUSDT chart, price has broken above the mid-term channel resistance and is currently pulling back. If the support zone holds, there’s potential for continuation toward higher resistance levels. A bullish reaction from the 2.299 USDT area could validate the next leg up.
🔄 If the correction deepens, the highlighted pink zone offers a strong re-entry opportunity. Key targets on the upside include 2.570, 2.740, and potentially 2.940 USDT if momentum continues.
✅ Key Support Levels:
- 🟥 2.401 USDT
- 🟥 2.299 USDT
- 🟥 2.035 USDT
- 🟥 1.830 USDT
🚫 Key Resistance Levels:
- 🟩 2.570 USDT
- 🟩 2.740 USDT
- 🟩 2.940 USDT
Trade closed: target reached
Related publications
Disclaimer
The information and publications are not meant to be, and do not constitute, financial, investment, trading, or other types of advice or recommendations supplied or endorsed by TradingView. Read more in the Terms of Use.
Related publications
Disclaimer
The information and publications are not meant to be, and do not constitute, financial, investment, trading, or other types of advice or recommendations supplied or endorsed by TradingView. Read more in the Terms of Use.