Structure:
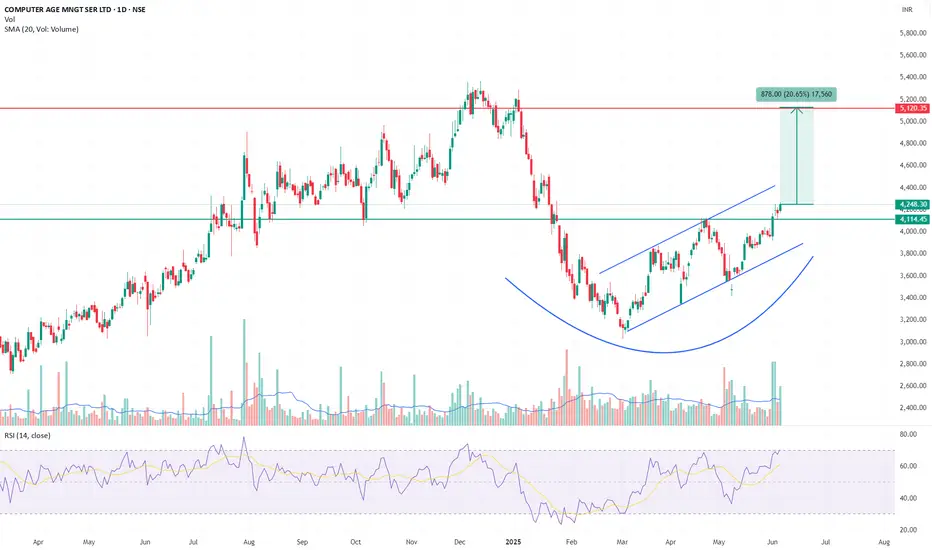
CAMS has completed a classic rounding bottom formation over the past three months, with the neckline placed around ₹4,200. Price action from the March 2025 lows (~₹3,100) has remained within a well-defined ascending channel, signaling steady accumulation and controlled institutional entry.
On June 5, 2025, the stock gave a clean breakout above ₹4,200 with a strong bullish candle, closing at ₹4,248.30. Importantly, the move came with a volume of 877.56K, significantly higher than the 20-day average (576K), validating the breakout strength.
Momentum indicators are supportive — RSI has now crossed 70, confirming entry into bullish momentum territory without showing divergence or exhaustion yet.
Breakout Snapshot:
🎯 Target: ₹5,120
📉 Stop-Loss: ₹4,000 (below breakout and channel support)
📈 Potential Upside: ~20%
⚖️ Risk-Reward: ~3.6x
Why It Matters:
CAMS has historically respected multi-month consolidations and offers clean post-breakout runs when supported by volume. This setup reflects a transition from accumulation to trend. The ascending structure indicates that smart money entered gradually — now validated with the breakout and volume spike.
Not a call to chase — idea is based on price-volume confirmation after a long base formation. Ideal entries are either near breakout (done) or on retest toward ₹4,180–₹4,200.
Track These:
Disclaimer:
This analysis is for educational and informational purposes only. It does not constitute investment advice or a recommendation to buy or sell any security. Please consult your financial advisor before making any trading decisions.
CAMS has completed a classic rounding bottom formation over the past three months, with the neckline placed around ₹4,200. Price action from the March 2025 lows (~₹3,100) has remained within a well-defined ascending channel, signaling steady accumulation and controlled institutional entry.
On June 5, 2025, the stock gave a clean breakout above ₹4,200 with a strong bullish candle, closing at ₹4,248.30. Importantly, the move came with a volume of 877.56K, significantly higher than the 20-day average (576K), validating the breakout strength.
Momentum indicators are supportive — RSI has now crossed 70, confirming entry into bullish momentum territory without showing divergence or exhaustion yet.
Breakout Snapshot:
- Pattern: Rounding Bottom + Ascending Channel
- Breakout Level: ₹4,200
- Entry: ₹4,248.30 (EOD Jun 5, 2025)
- Volume: 877.56K vs 20-SMA 576K
- RSI: 70.11 → strong bullish confirmation
🎯 Target: ₹5,120
📉 Stop-Loss: ₹4,000 (below breakout and channel support)
📈 Potential Upside: ~20%
⚖️ Risk-Reward: ~3.6x
Why It Matters:
CAMS has historically respected multi-month consolidations and offers clean post-breakout runs when supported by volume. This setup reflects a transition from accumulation to trend. The ascending structure indicates that smart money entered gradually — now validated with the breakout and volume spike.
Not a call to chase — idea is based on price-volume confirmation after a long base formation. Ideal entries are either near breakout (done) or on retest toward ₹4,180–₹4,200.
Track These:
- ₹4,400: Minor resistance
- ₹5,120: Measured move target
- ₹4,000: Invalidation zone
- RSI > 75: Overheat caution
Disclaimer:
This analysis is for educational and informational purposes only. It does not constitute investment advice or a recommendation to buy or sell any security. Please consult your financial advisor before making any trading decisions.
Note
📉 Update (Jun 14, 2025): Breakout Failed – Exit TriggeredDespite a strong breakout above ₹4,200 on volume (Jun 5), the price has since broken below key support levels, including:
Ascending channel support
Breakout zone at ₹4,114
Multiple daily closes below structure
The EOD close on Jun 14 at ₹3,980 confirms a failed breakout with breakdown in both momentum (RSI < 50) and price structure.
🔴 Trade Invalidated
⛔ Exit Position if Still Holding – original thesis no longer holds
📉 CAMS reverts to watchlist until a fresh base and reclaim of ₹4,200+
This update reflects a disciplined closure of a failed trade, not a view on business fundamentals.
Trade closed: stop reached
Disclaimer
The information and publications are not meant to be, and do not constitute, financial, investment, trading, or other types of advice or recommendations supplied or endorsed by TradingView. Read more in the Terms of Use.
Disclaimer
The information and publications are not meant to be, and do not constitute, financial, investment, trading, or other types of advice or recommendations supplied or endorsed by TradingView. Read more in the Terms of Use.